Jsonb: few more stories about the performance
21 Dec 2017As such, there’s really no “standard” benchmark that will inform you about the best technology to use for your application. Only your requirements, your data, and your infrastructure can tell you what you need to know.
For already some time I can’t stop doing interesting/useful/weird (one at the time) benchmarks to reveal some details on how to apply document-oriented approach in the world of relational databases. Finally, I decided that I have a critical mass of those details to share in the form of blog post. So welcome to The Benchmark Club, where we’re going to discuss what it takes to create a fair performance comparison of different databases. As you may guess, the first rule of The Benchmark Club is to never share a reproducible benchmarks. But we identify ourselves as a badass engineers, so we’re going to break this rule today.

Targets
It’s not possible to compare all the existing solutions to store and process the data in form of documents (although looks like people usually expect exactly that), so I’ve limited my scope to PostgreSQL, MySQL and MongoDB:
-
PostgreSQL - just because it’s an enlightened database, which is a part of my very existence.
-
MySQL - also has quite decent implementation of binary json, so it’s interesting to compare PostgreSQL with one of its closest rival.
-
MongoDB - one of the most popular NoSQL databases. Sort of synonym for “document-oriented” approach as for me.
Environment
Unfortunately for me, I don’t have any bare metal servers to test the performance. So all my tests were made using AWS EC2, which has its own pros and cons:
- Super easy to reproduce the same results on your own.
- Many companies use AWS as a main platform to run their infrastructure, so my results maybe even more relevant for them.
- But there are some implications of using EC2 for performance tests.
My typical benchmark environment had two EC2 instances, one for a workload
generator, another for a database. I was using m4.large instance type with a
gp2 ELB volume and the default Ubuntu 16.04 AMI image, so HVM virtualization
was available. Both instances were in the same availability zone, VPC and
placement group, so we eliminated significant networking issues.
But it’s not really enough to be confident in results. There are still some interesting performance-relevant details about using EC2 (e.g. it’s usually advised to disable hyper-threading to get better latency), and in general benchmarking is quite dangerous area (only insane persons join The Benchmark Club, because everyone thinks he is smarter than you, but no one wants to help). To at least partially mitigate those possible issues and make sure that my tests are more reproducible I tried to be as careful as possible - for almost every use case I did at least 4 rounds of the same benchmark (and usually even more).
As a tool for benchmarks I used YCSB, which is a quite well-known instrument to test the performance of NoSQL databases. It provides many interesting types of workload, but unfortunately only documents of quite simple structure are involved. To be more precise, YCSB uses simple flat documents with some number of keys and corresponding values, which is not that close to the reality from my point of view. That’s why I also created a fork of this tool, where I introduced the possibility of creating documents with some complex structure, and drivers for PostgreSQL (jsonb) and MySQL (binary json) (warning: I should mention, that it’s not a code I can be proud of, but you know - “it works for me”).
To create an environment, I have an ansible playbook (for those of you who had seen my talks about this topic on various conferences, this playbook always was public, but after some time I stopped to include it into my slides, since there was no real feedback), that accepts some parameters like EC2 key, availability zone and other stuff, and creates all the required instances, configures them, and starts data load stage and actual test. The only thing you need to do manually is to create subnets with all the security groups for your databases (I’m just to lazy to automate it). Unfortunately, Ansible itself became an issue at some point, since it still uses Python2, which is not available on the latest versions of Ubuntu, so there are few hack required to be able to use it.
Besides running database itself, every instance also collecting system metrics
using sar tool (plus some database related metrics from pgview or
mongotop), and they’re available after a test.
Few random notes. I’m not sure about current situation, but when I was writing all those scripts there was no proper service in the latest versions of Ubuntu for the latest version of MongoDB. Which means I had to include one more template and create this service myself.
Another nice thing that costs me several sleepless nights is something called “unattended-upgrades”. This Ubuntu service could wake up sometimes and start to update the system. Besides the minor fact that I just don’t need to have this overhead, this caused test failures sometimes because of a lock for package installation. So I disabled it. Generaly speaking, to prevent flaky tests it totally makes sense to add Ansible retry to update packages section, something like:
until: update_result.stderr == ""
retries: 10
delay: 1
ignore_errors: yes
One more thing that you can do to make your life easier is to add
host_key_checking = False # we know our hosts
timeout = 60  # or even more
pipelining = True # reduce number of SSH operations
into ansible.cfg on your host machine (pipelining theoretically can break
compatibility with sudoers configurations, but I never experienced anything
like that in my tests).
To save some money and time, almost for all tests I actually used already prepared AMI images with everything I need. But if you preload test data into this image, you have to understand, that obviously there will be no data in the cache at the start of a test.
Configurations
In my tests I used some variety of database versions:
-
PostgreSQL 9.6.3/10
-
MongoDB 3.2.5/3.4.4
-
MySQL 5.7.19/8.0.3
To make it simple, you can assume that we’re using the latest stable version, and I’m going to mention a particular version only if it makes some performance difference.
When dealing with configurations for these databases, I tried to adjust only those options, that were directly related to either instance parameters or the nature of a workload. Everything more detailed I left for the next part of my research. This led me to the following important options:
-
PostgreSQL
-
shared_buffers
-
effective_cache_size
-
max_wal_size
-
checkpoint_completion_target
-
-
MySQL
-
innodb_buffer_pool_size
-
innodb_log_file_size
-
-
MongoDB
-
write concern level
-
checkpoints
-
eviction
-
transaction_sync (just out of curiosity, it’s not really recommended to use)
-
Few important notes:
-
proper data consistency is used for all the tests (which means write concern journaled for MongoDB)
-
SSL was disabled (it’s like that for PostgreSQL and MongoDB, for MySQL driver I had to disable it manually)
-
for PostgreSQL and MySQL prepared statements were used
-
all databases were used in a single instance form. For MongoDB it’s actually quite unnatural, and usually you want to use replication to get the eventual consistency. But at the same time it allows us to test all involved databases under the similar conditions when they do more or less the same work. Right now I’m working on the second part of my test suite to test databases clusters, so you can think about this one as a first step, that nonetheless is quite interesting by itself.
And few words about types of documents that were involved. With the default YCSB I can define:
-
“simple” or “small” document - 10 keys and values, every value is 100 random characters
-
“large” document - 100 keys and values, every value is 200 random characters
And using my fork I also can define:
- “complex” document - 100 keys and values that form a tree with 3 nesting levels, every value is 100 random characters
Read workload
YCSB provides several interesting types of workload to
simulate real world situations. Let’s start with the simples one, WorkloadC,
that consists 100% of read queries. Every read query fetches a single document
by its ID, so we need to discuss how can we index our documents:
-
PostgreSQL - we can index either a single path/multiple paths (using regular functional index) or all paths (using GIN index) inside a document.
-
MongoDB - we can index either a signle path or multiple paths inside a document.
-
MySQL - there is no direct support for indexing binary json, but we can create a virtual column and index it as usual. So, again, a single or multiple paths inside a document.
Let’s try to make a simple performance test using “default” indexing approach, which means we’re going to index an entire document for PostgreSQL, only ID in MongoDB, and only ID in a separate virtual column in MySQL.
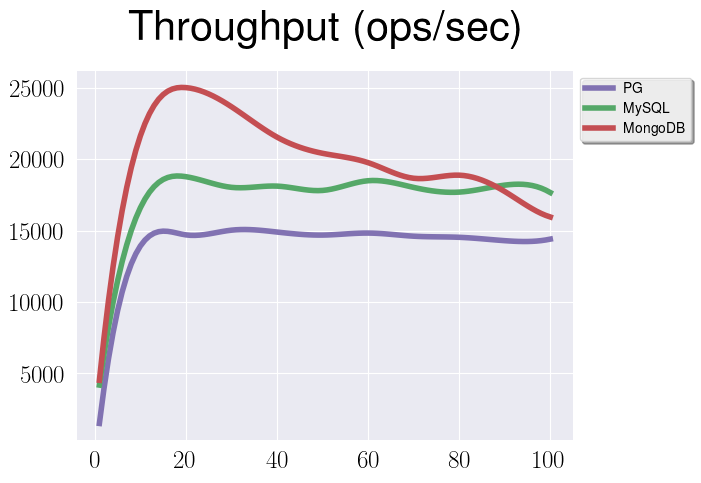
This graph represents throughput for under a WorkloadC for all the databases.
By Ox we have a number of clients that are querying our databases, so basically
it’s a level of concurrency. By Oy there is a throughput value.
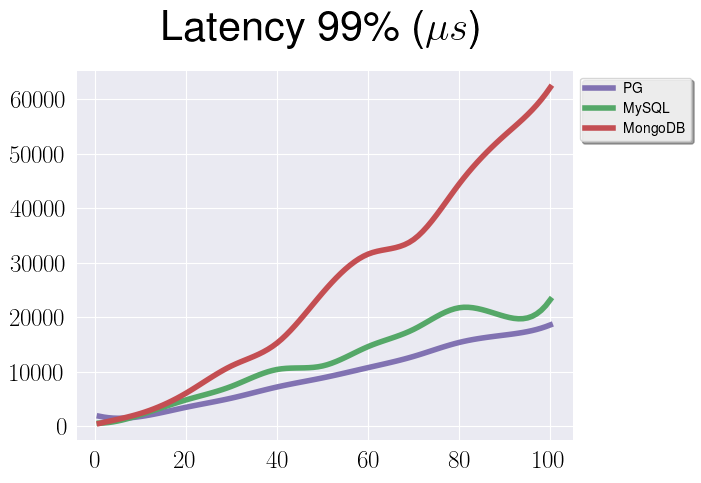
On this graph you can see a 99th percentile of latency for the same test.
And I bet you already have a lot of questions about this data. Since we strive to get a fair comparison, we need to discuss and explain them:
-
Why there is a spike for all of them at about 20 clients?
-
Why there is a performance degradation for MongoDB when number of clients is growing?
-
Why there is a performance gap between MySQL and MongoDB?
-
Why there is a performance gap between PostgreSQL and MongoDB?
Spike at 20 clients
That one is probably the easiest one and it relates to an instance configuration. The next graph shows the CPU consumption for PostgreSQL in a test with exactly 20 clients.
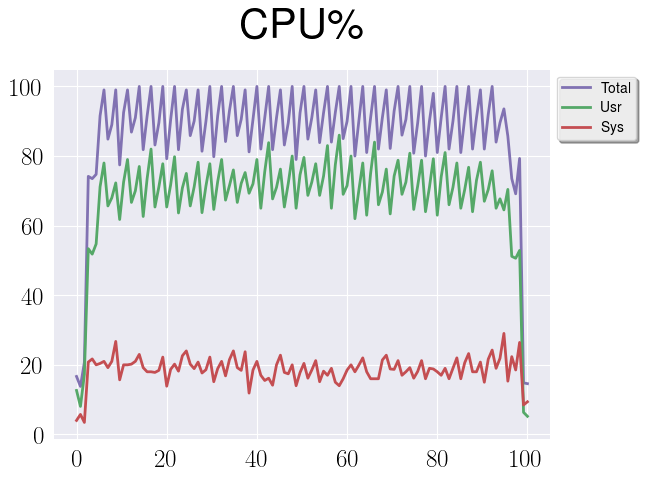
As you can see, CPU resources almost completely consumed, and judging from the same metrics before 20 clients we still have some capacity. So that’s the explanation for this spike.
Performance degradation for MongoDB
It was tricky to find out what’s happening here, because all the metrics that
I’ve got from sar were on the same level for 20 and 100 clients. So, as part
of my investigation I started to trace MongoDB with perf. It turns out that
the only two metrics that were growing significantly were number of CPU
migrations events and sched_yield system calls.
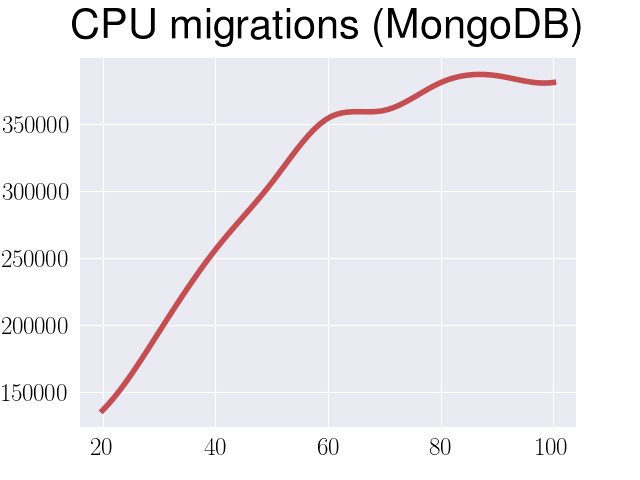
This led me to a conclusion that MongoDB has some problems with spinlocks,
since the only module that has sched_yield system call is spin_lock.cpp.
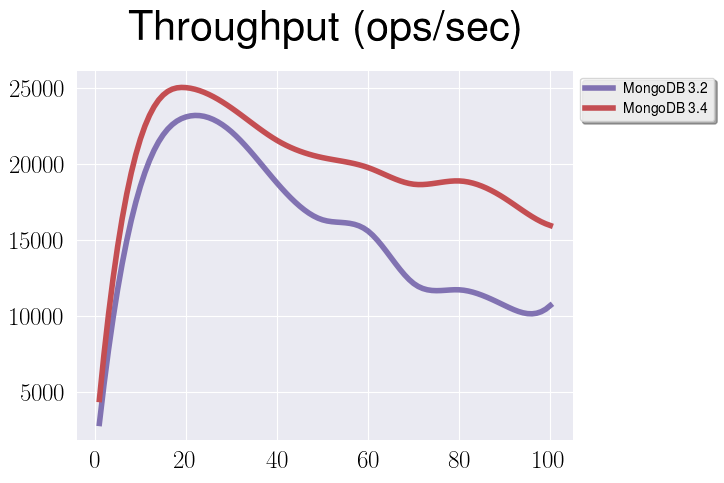
Interesting enough is that this situation is getting better between releases
(but it’s still quite significant), for example here is comparison of
throughput for 3.2 and 3.4:
MySQL vs MongoDB
Actually the performance for MySQL in the first tests was even worse. It turns
out, that since in MySQL we’re using a virtual column, we have to tell
explicitly that it should be stored using STORED statement:
CREATE TABLE usertable (
data JSON,
ycsb_key VARCHAR(255)
    GENERATED ALWAYS AS (JSON_EXTRACT(data, '$.YCSB_KEY'))
    STORED PRIMARY KEY
);
But even with this improvement it has lower throughput in this test. My
colleagues from MySQL side claim that it’s happened mostly because performance
schema collects more data and involves more actions than similar mechanisms in
other databases, which obviously leads to a bigger overhead. But at the same
time no one really disables it in production environment, and so far I decided
to do the same for my performance tests.
PostgreSQL vs MongoDB
I assume this one is most important questions for you now. Why PostgreSQL is underperforms so significantly? The answer is simple, we’re doing an unfair benchmark. As you may notice, we were indexing only an ID in a document for MySQL and MongoDB, and an entire document for PostgreSQL. So, let’s try to fix that.
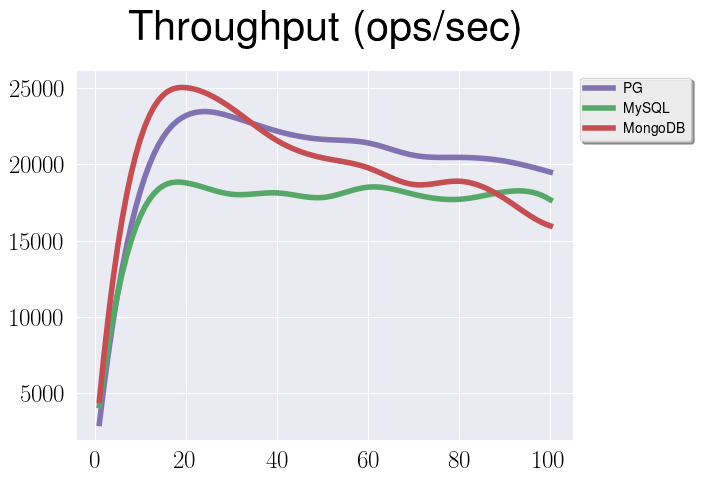
Here we can see absolutely the same test with the very change that we’re discussing, namely indexing only an ID for PostgreSQL. It’s clear now, that throughput for PostgreSQL and MongoDB now is almost the same before the spinlock performance degradation hits MongoDB. There is still a gap between PostgreSQL and MySQL though, and there are two factors contribute to this:
-
performance schemaas mentioned before -
prepared statements, since in MySQL they cache less information than in PostgreSQL, and consequently they are not that effective
And now let’s discuss a bit our results. We’ve got so far that throughput of PostgreSQL and MongoDB is the same for read workloads. Is it surprising? Not at all - I’m going to show you, that under the hood all our databases use more or less the same data structures and the same approach to store documents. Taking this into account, and also the same type of indices and the same environment it’s quite natural that we’ve got the same numbers.
Data structures
When we’re talking about how to store a document in a database, we usually have two concerns - our document should occupy as small a possible space, but at the same time we should be able to work with it efficiently. And thing is that to achieve that the only thing we can do is basically put some small amount of extra information into a document, e.g. for every key in it we can store a type and size of a corresponding value. That’s what we have in one or another form in all our target databases.
Here is a diagram that represents the internal structure of jsonb in
PostgreSQL:
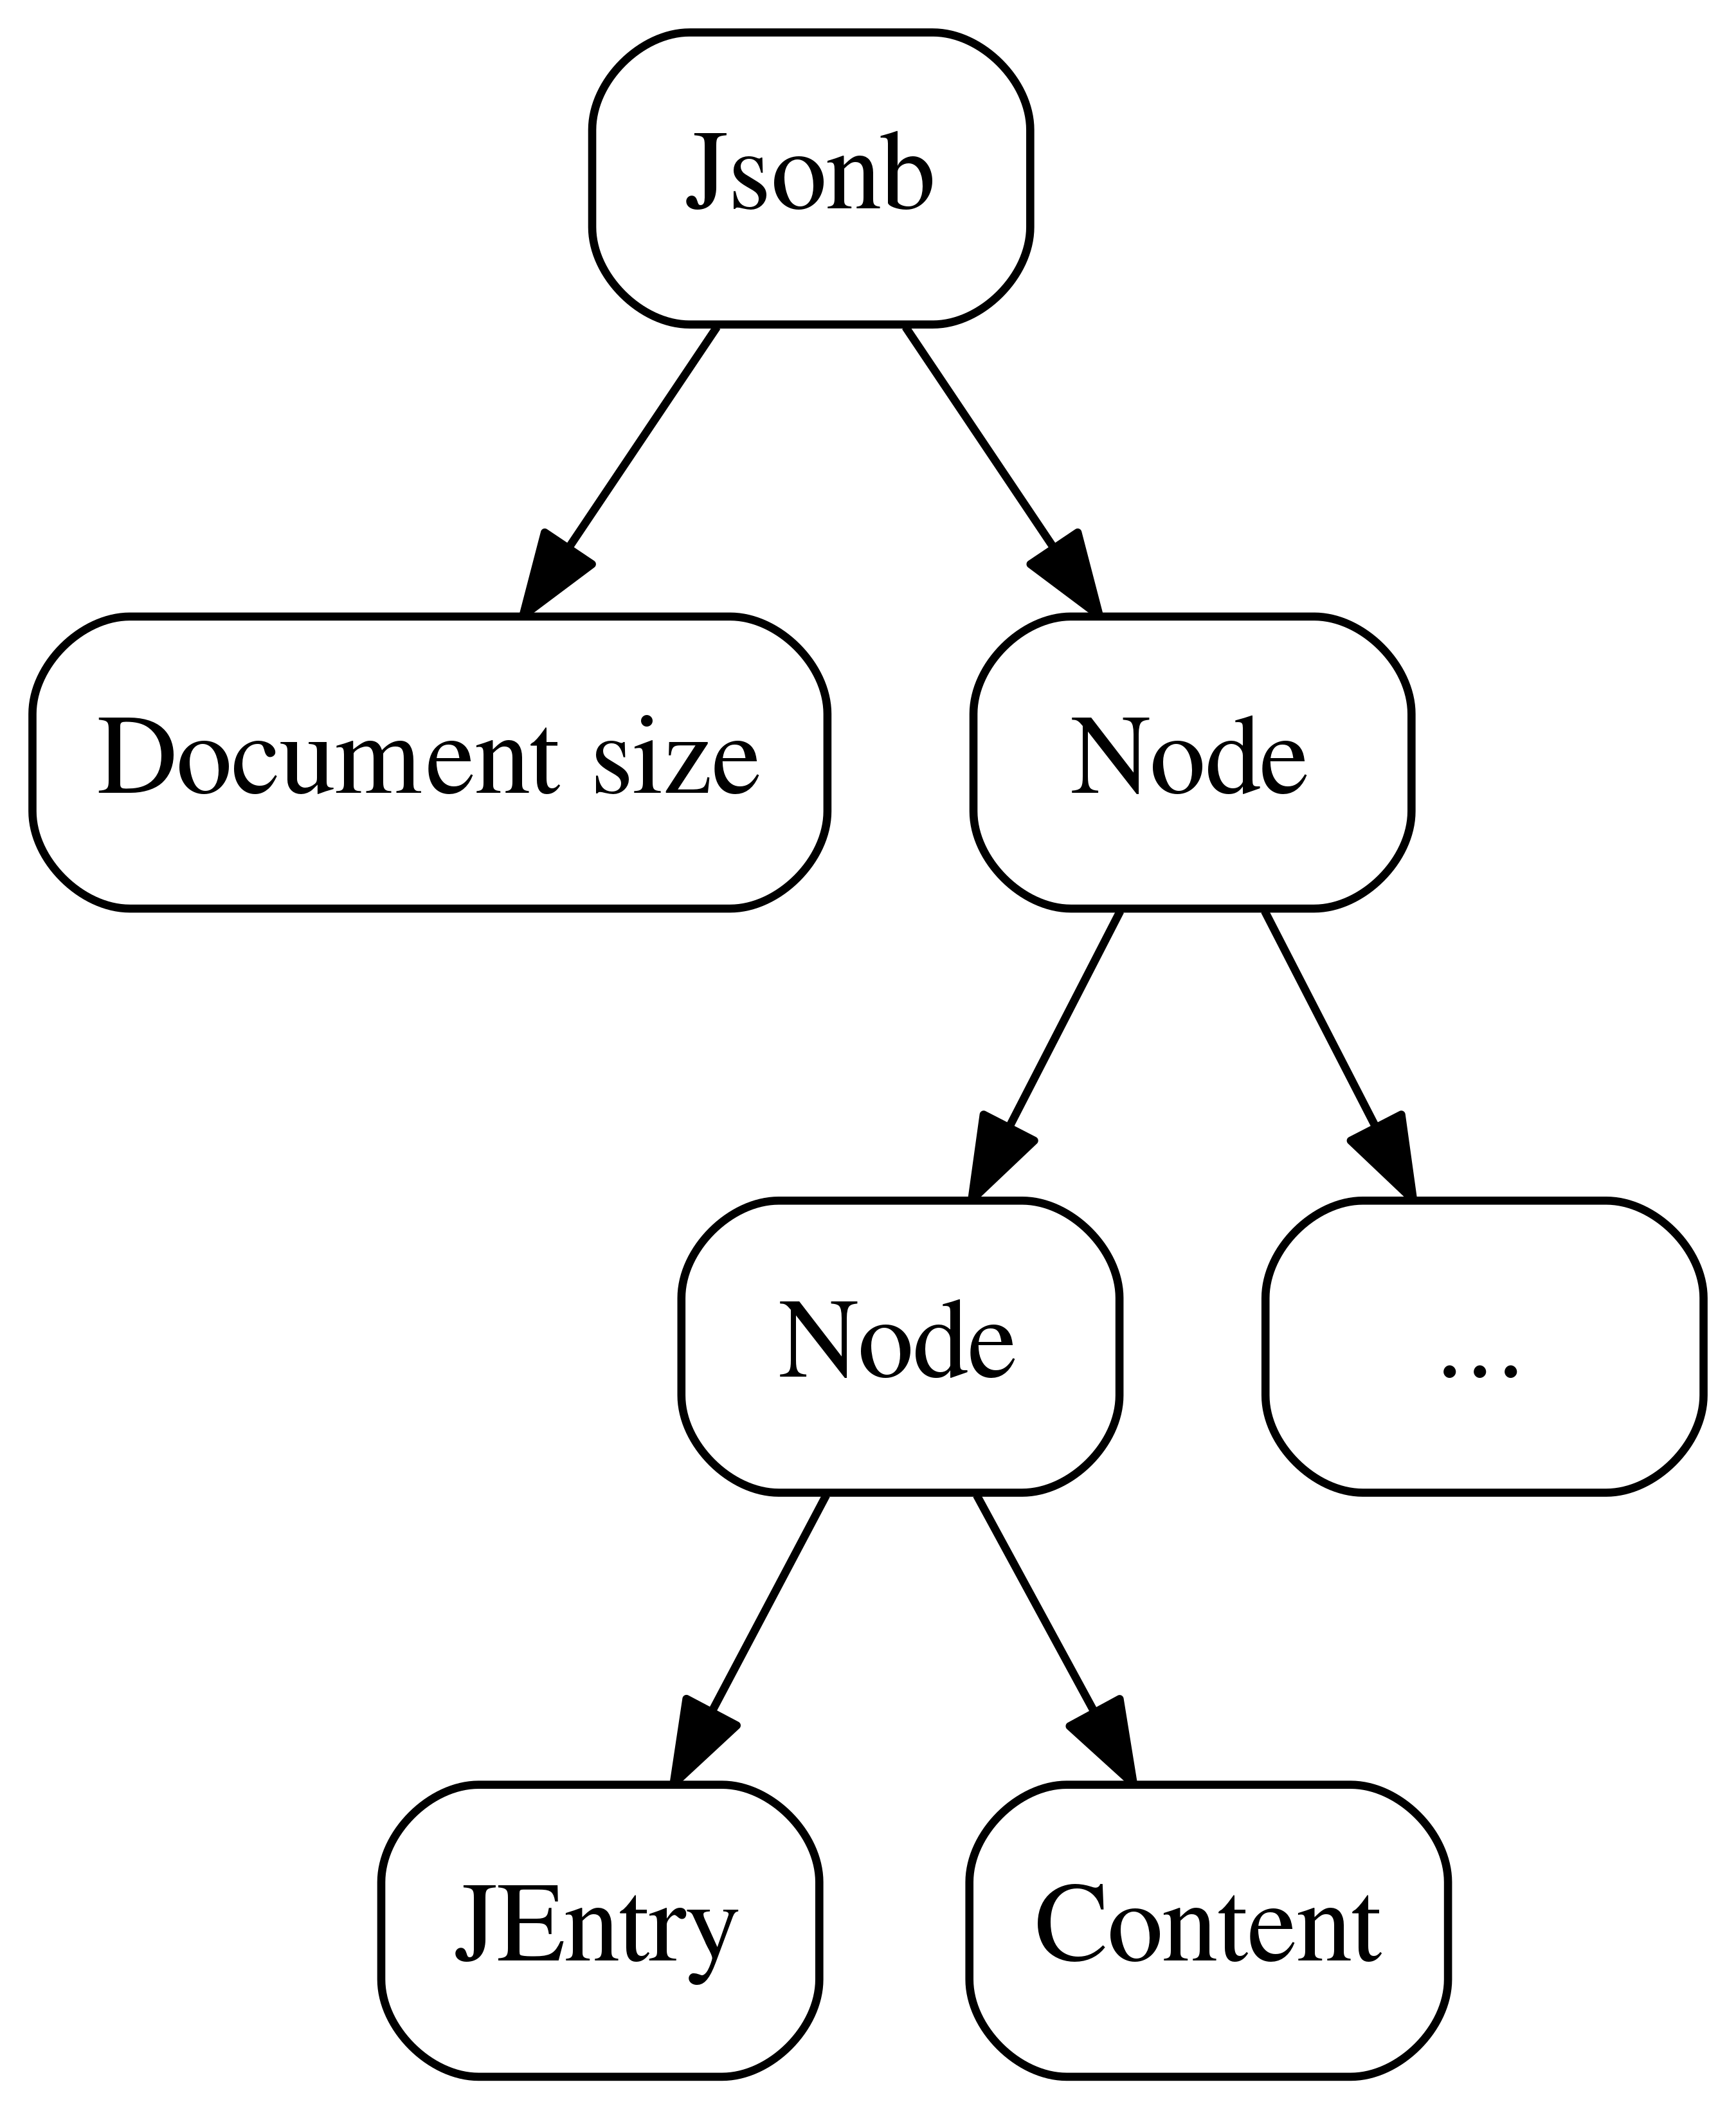
What we can see here is:
-
an overall document size
-
a tree, every node of which has a header and actual content
Let’s zoom a bit into a node structure:
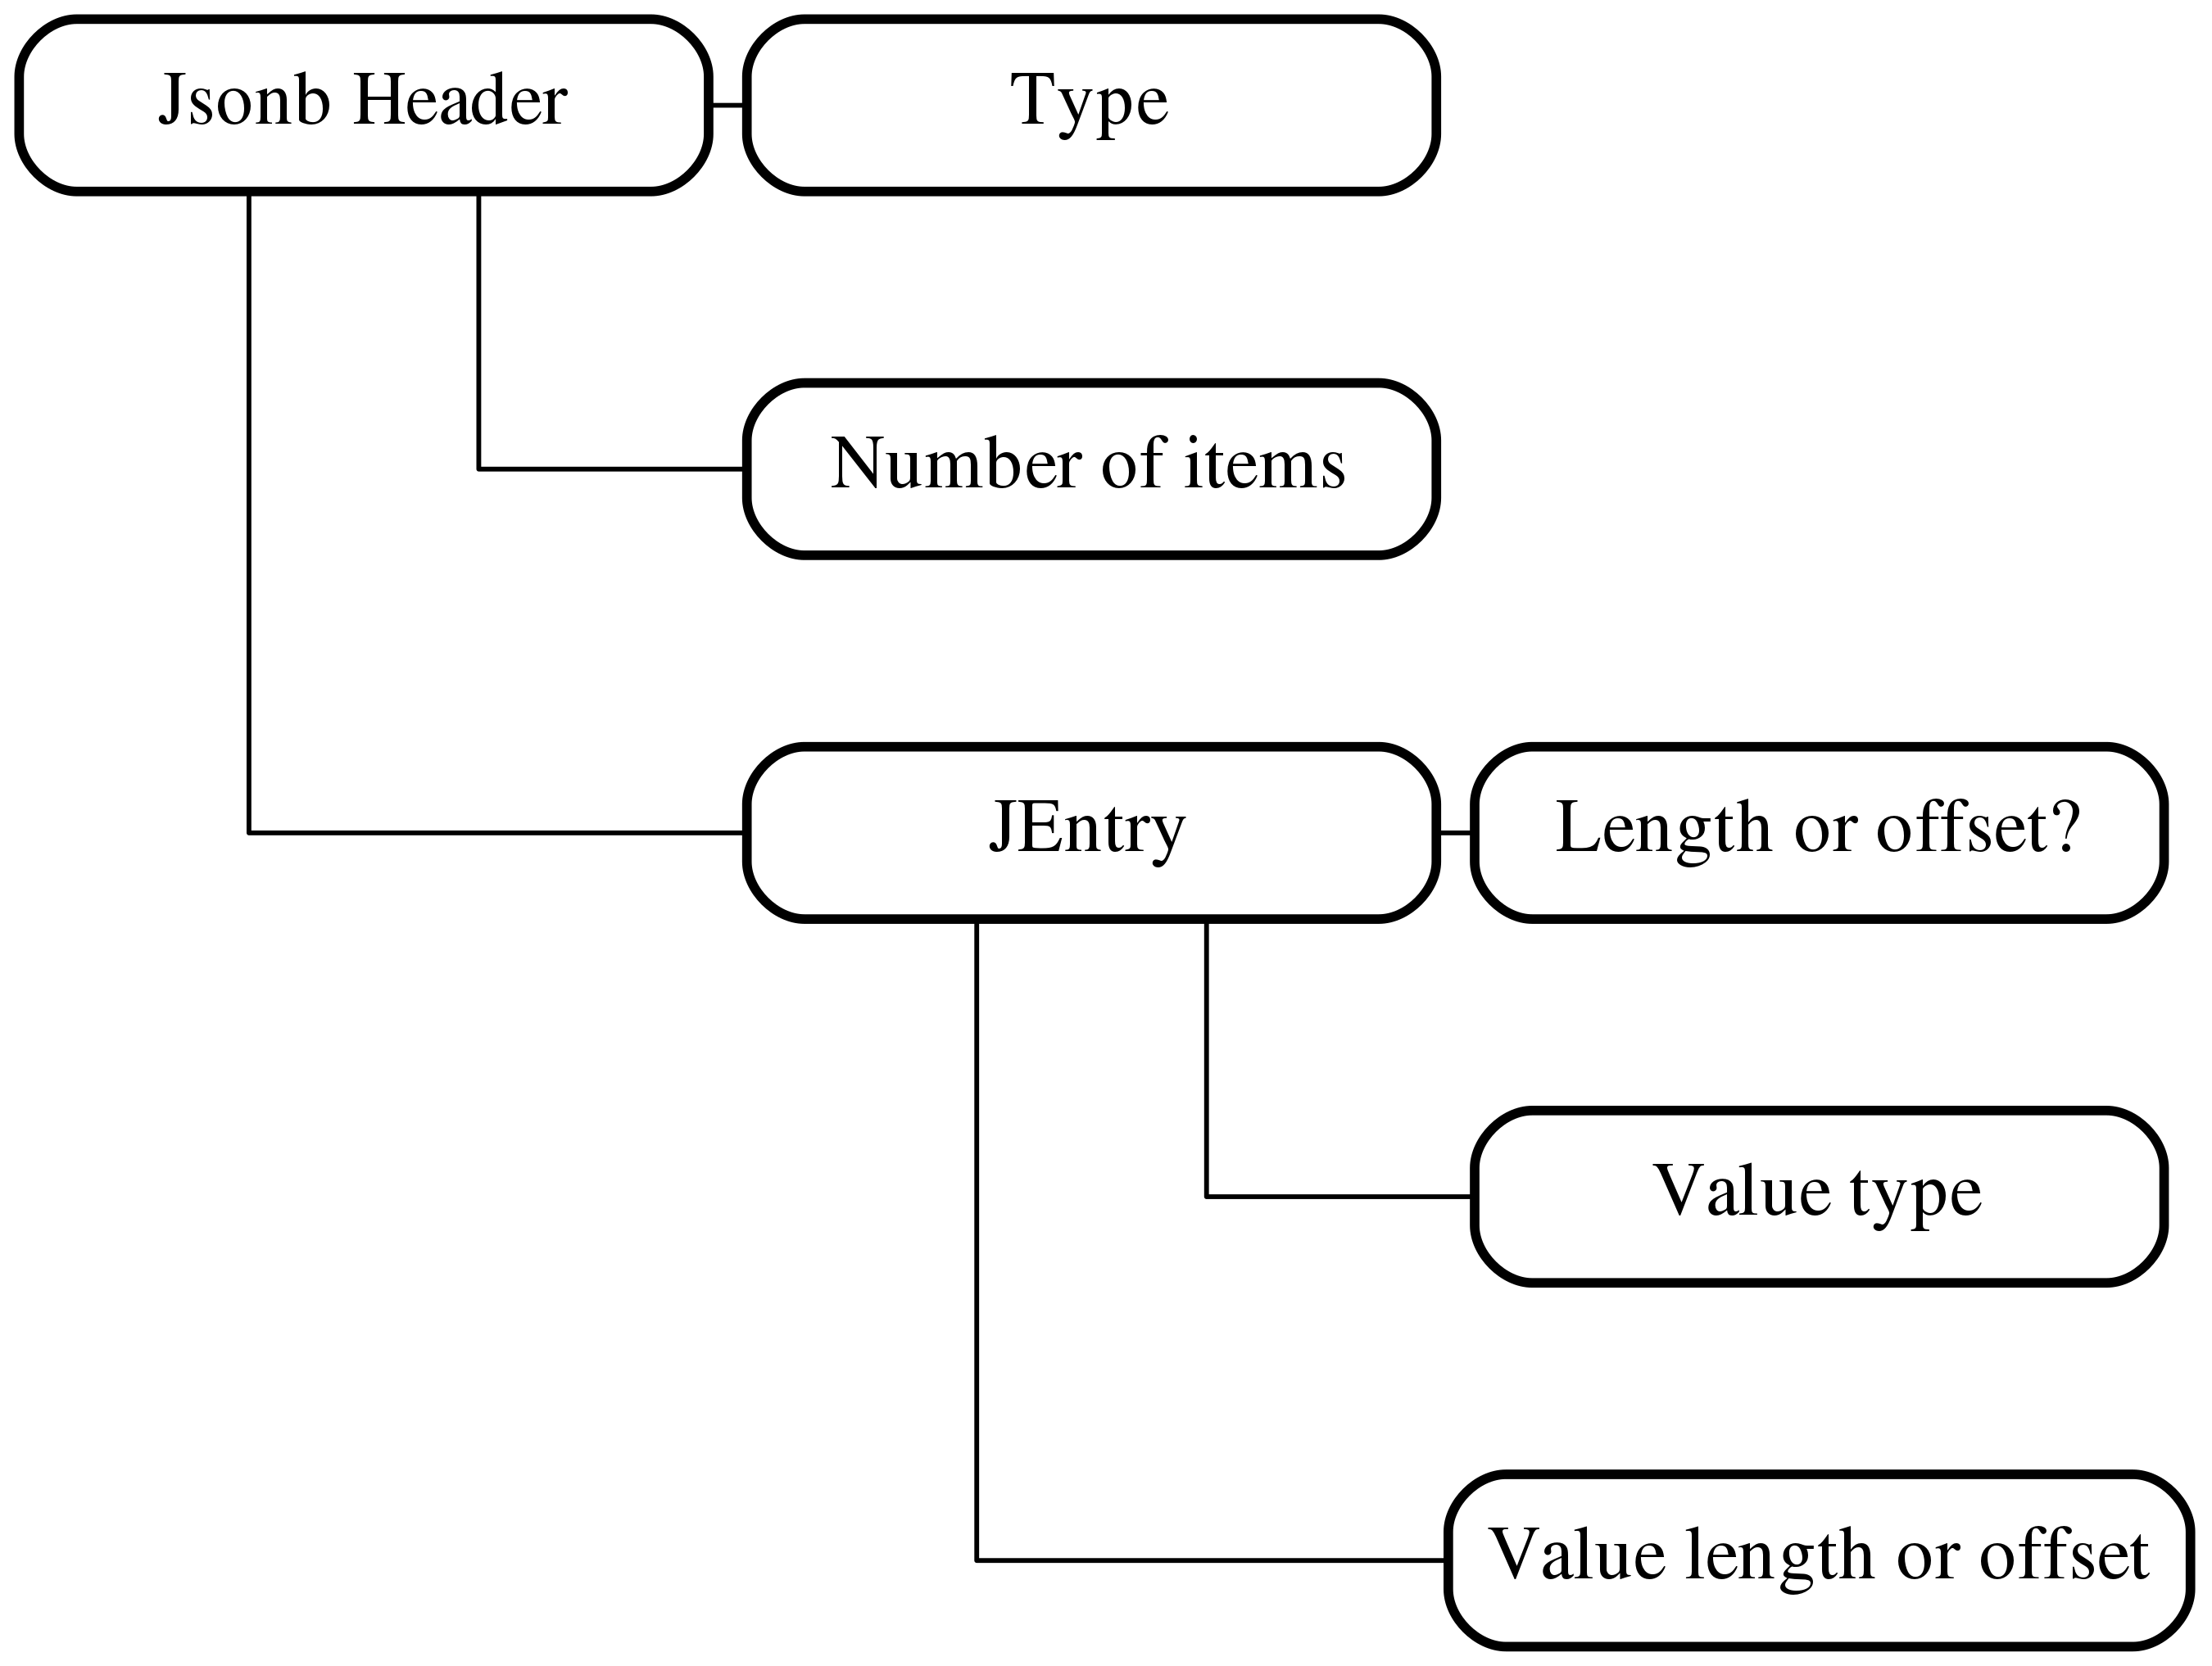
Basically, a node header has value type, value size or offset and one
cryptic flag to decide whether we store a size or offset. It was done like
that in attempt to find the balance - using an offset we can get more access
speed by the cost of compressibility, and better compressibility we can get
using size.
And here is a similar diagram for bson in MongoDB:

Not surprisingly we see almost the same picture with a document size, nodes in form of a tree structure and every node has its own header and actual content. And again let’s take a look at a node header structure:
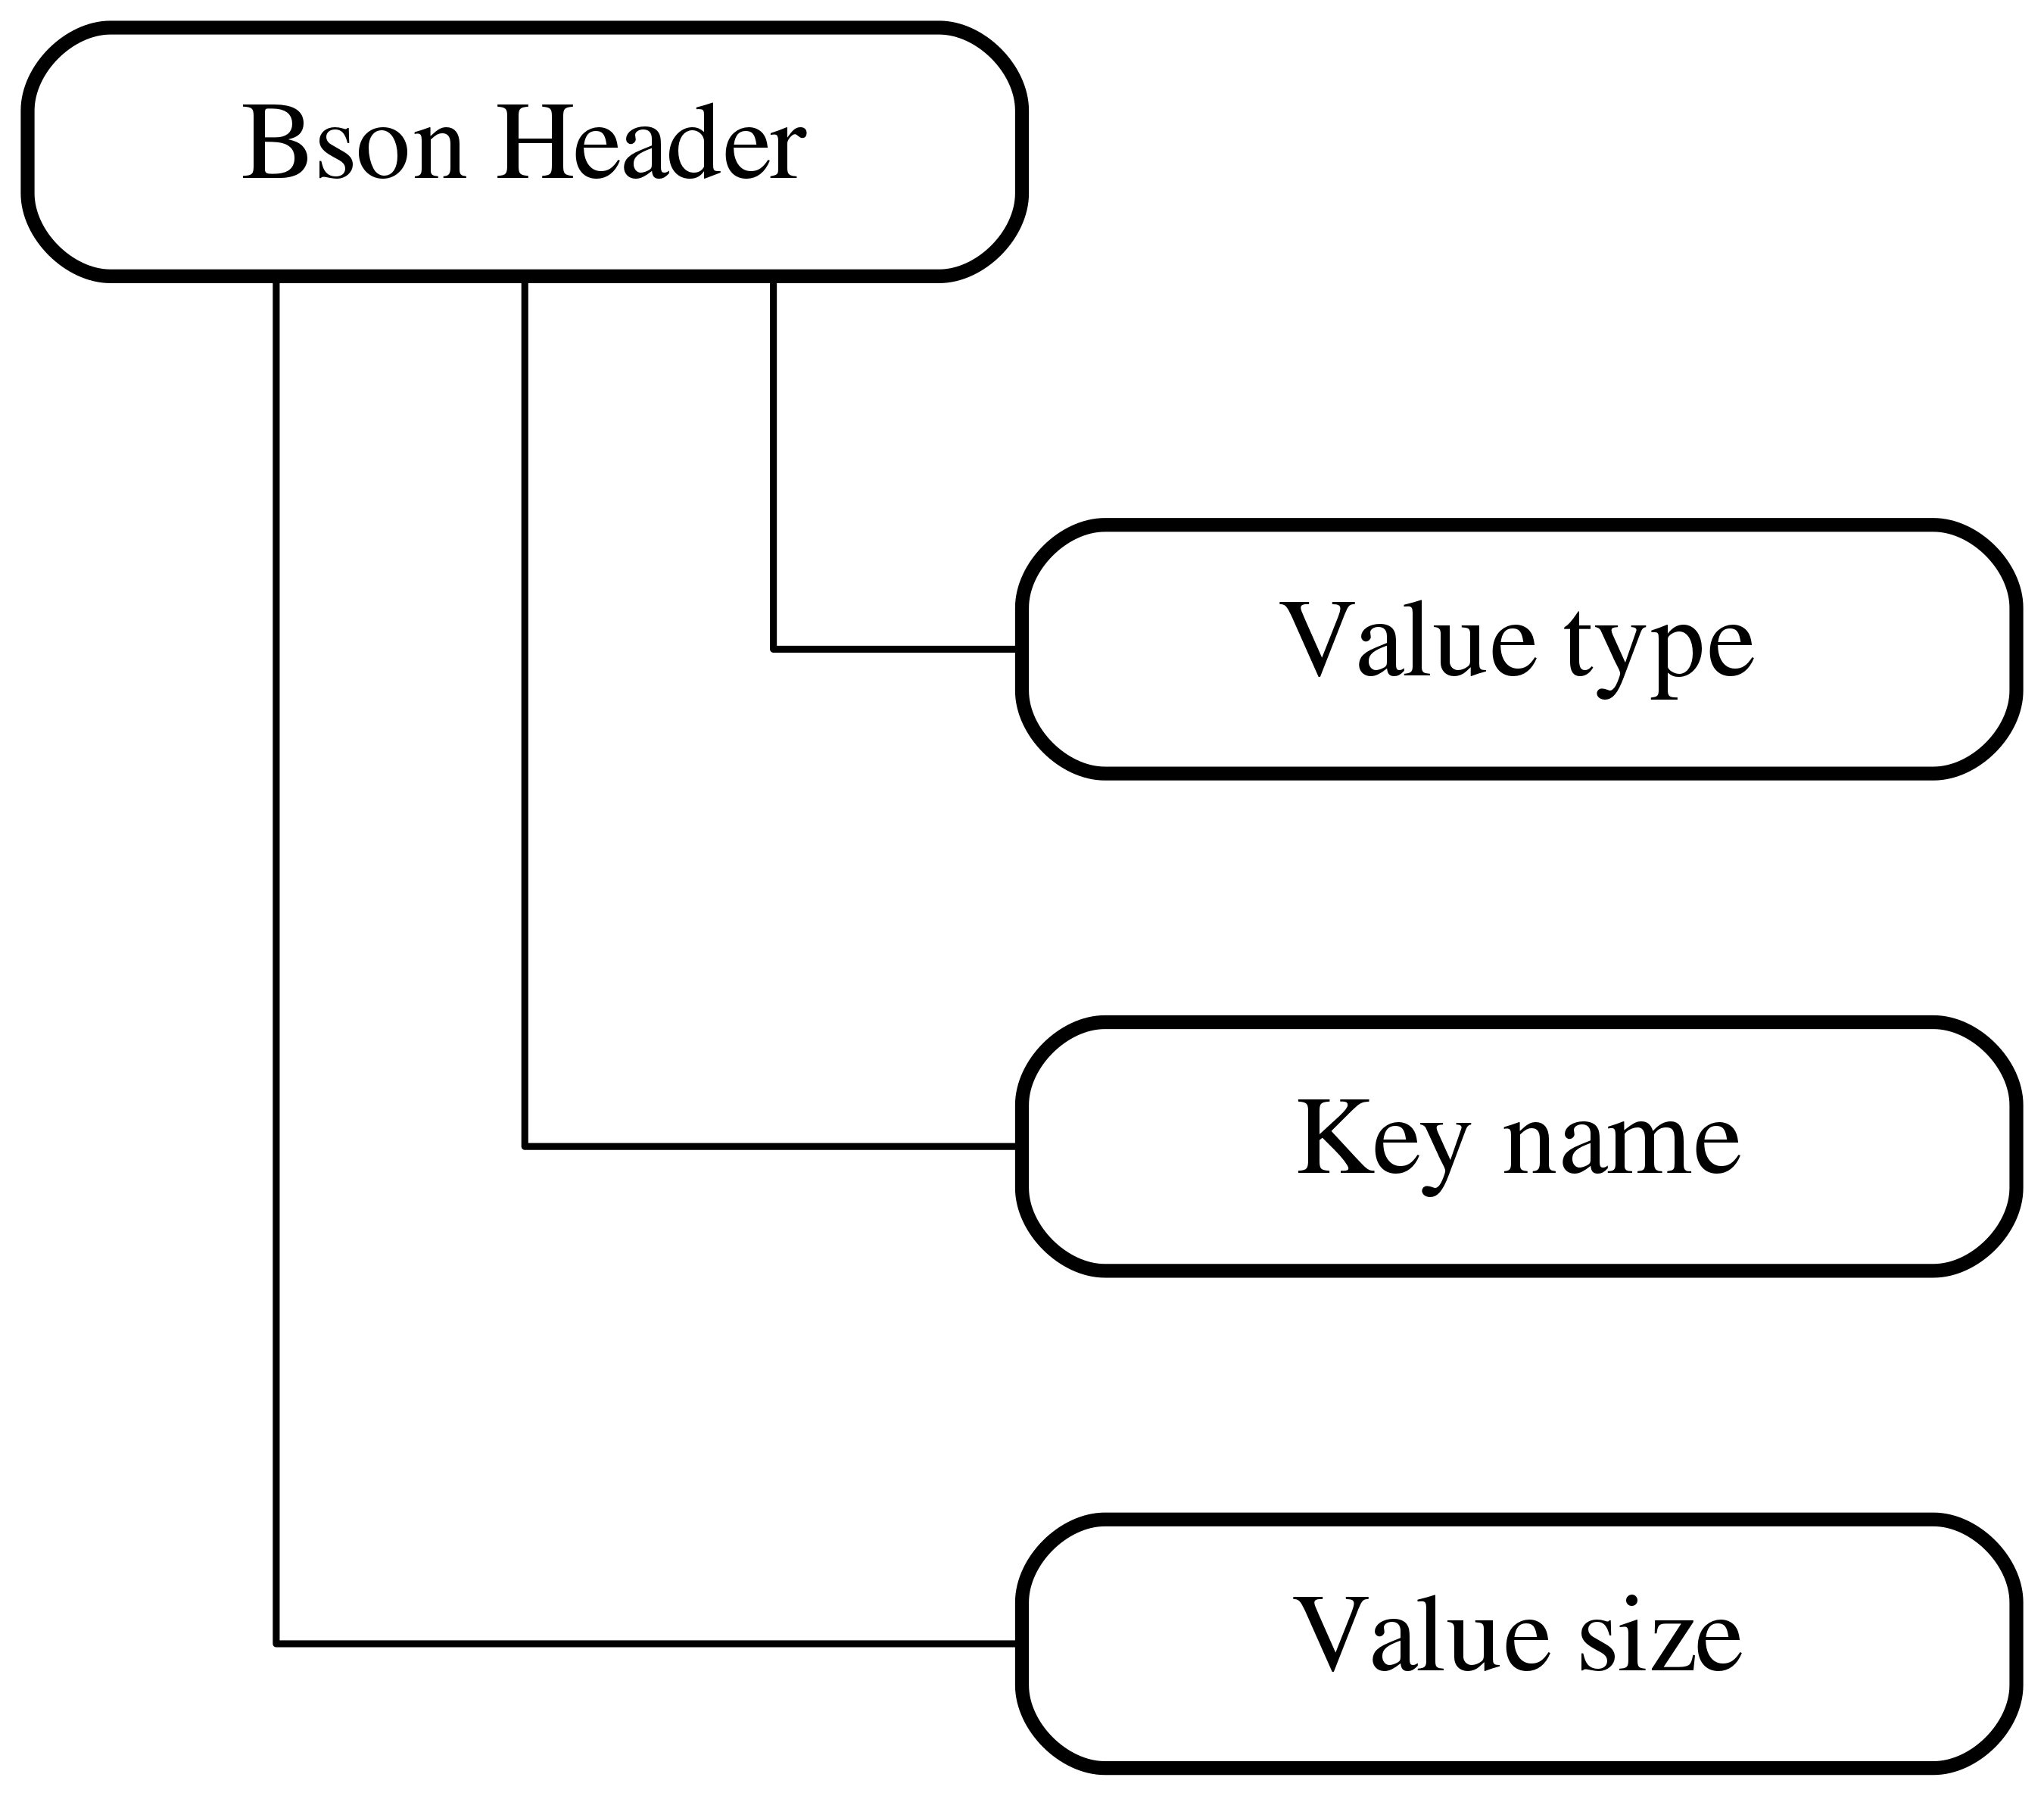
As before (not that many options), we have here value type, value size and
key name which is one small but interesting difference. The thing is that for
jsonb we store all keys and values in a variable sized content section, and
implicitly apply some order for them. In case of bson we store a key
directly in a node header.
Now let’s explore the internal structure of binary json in MySQL:
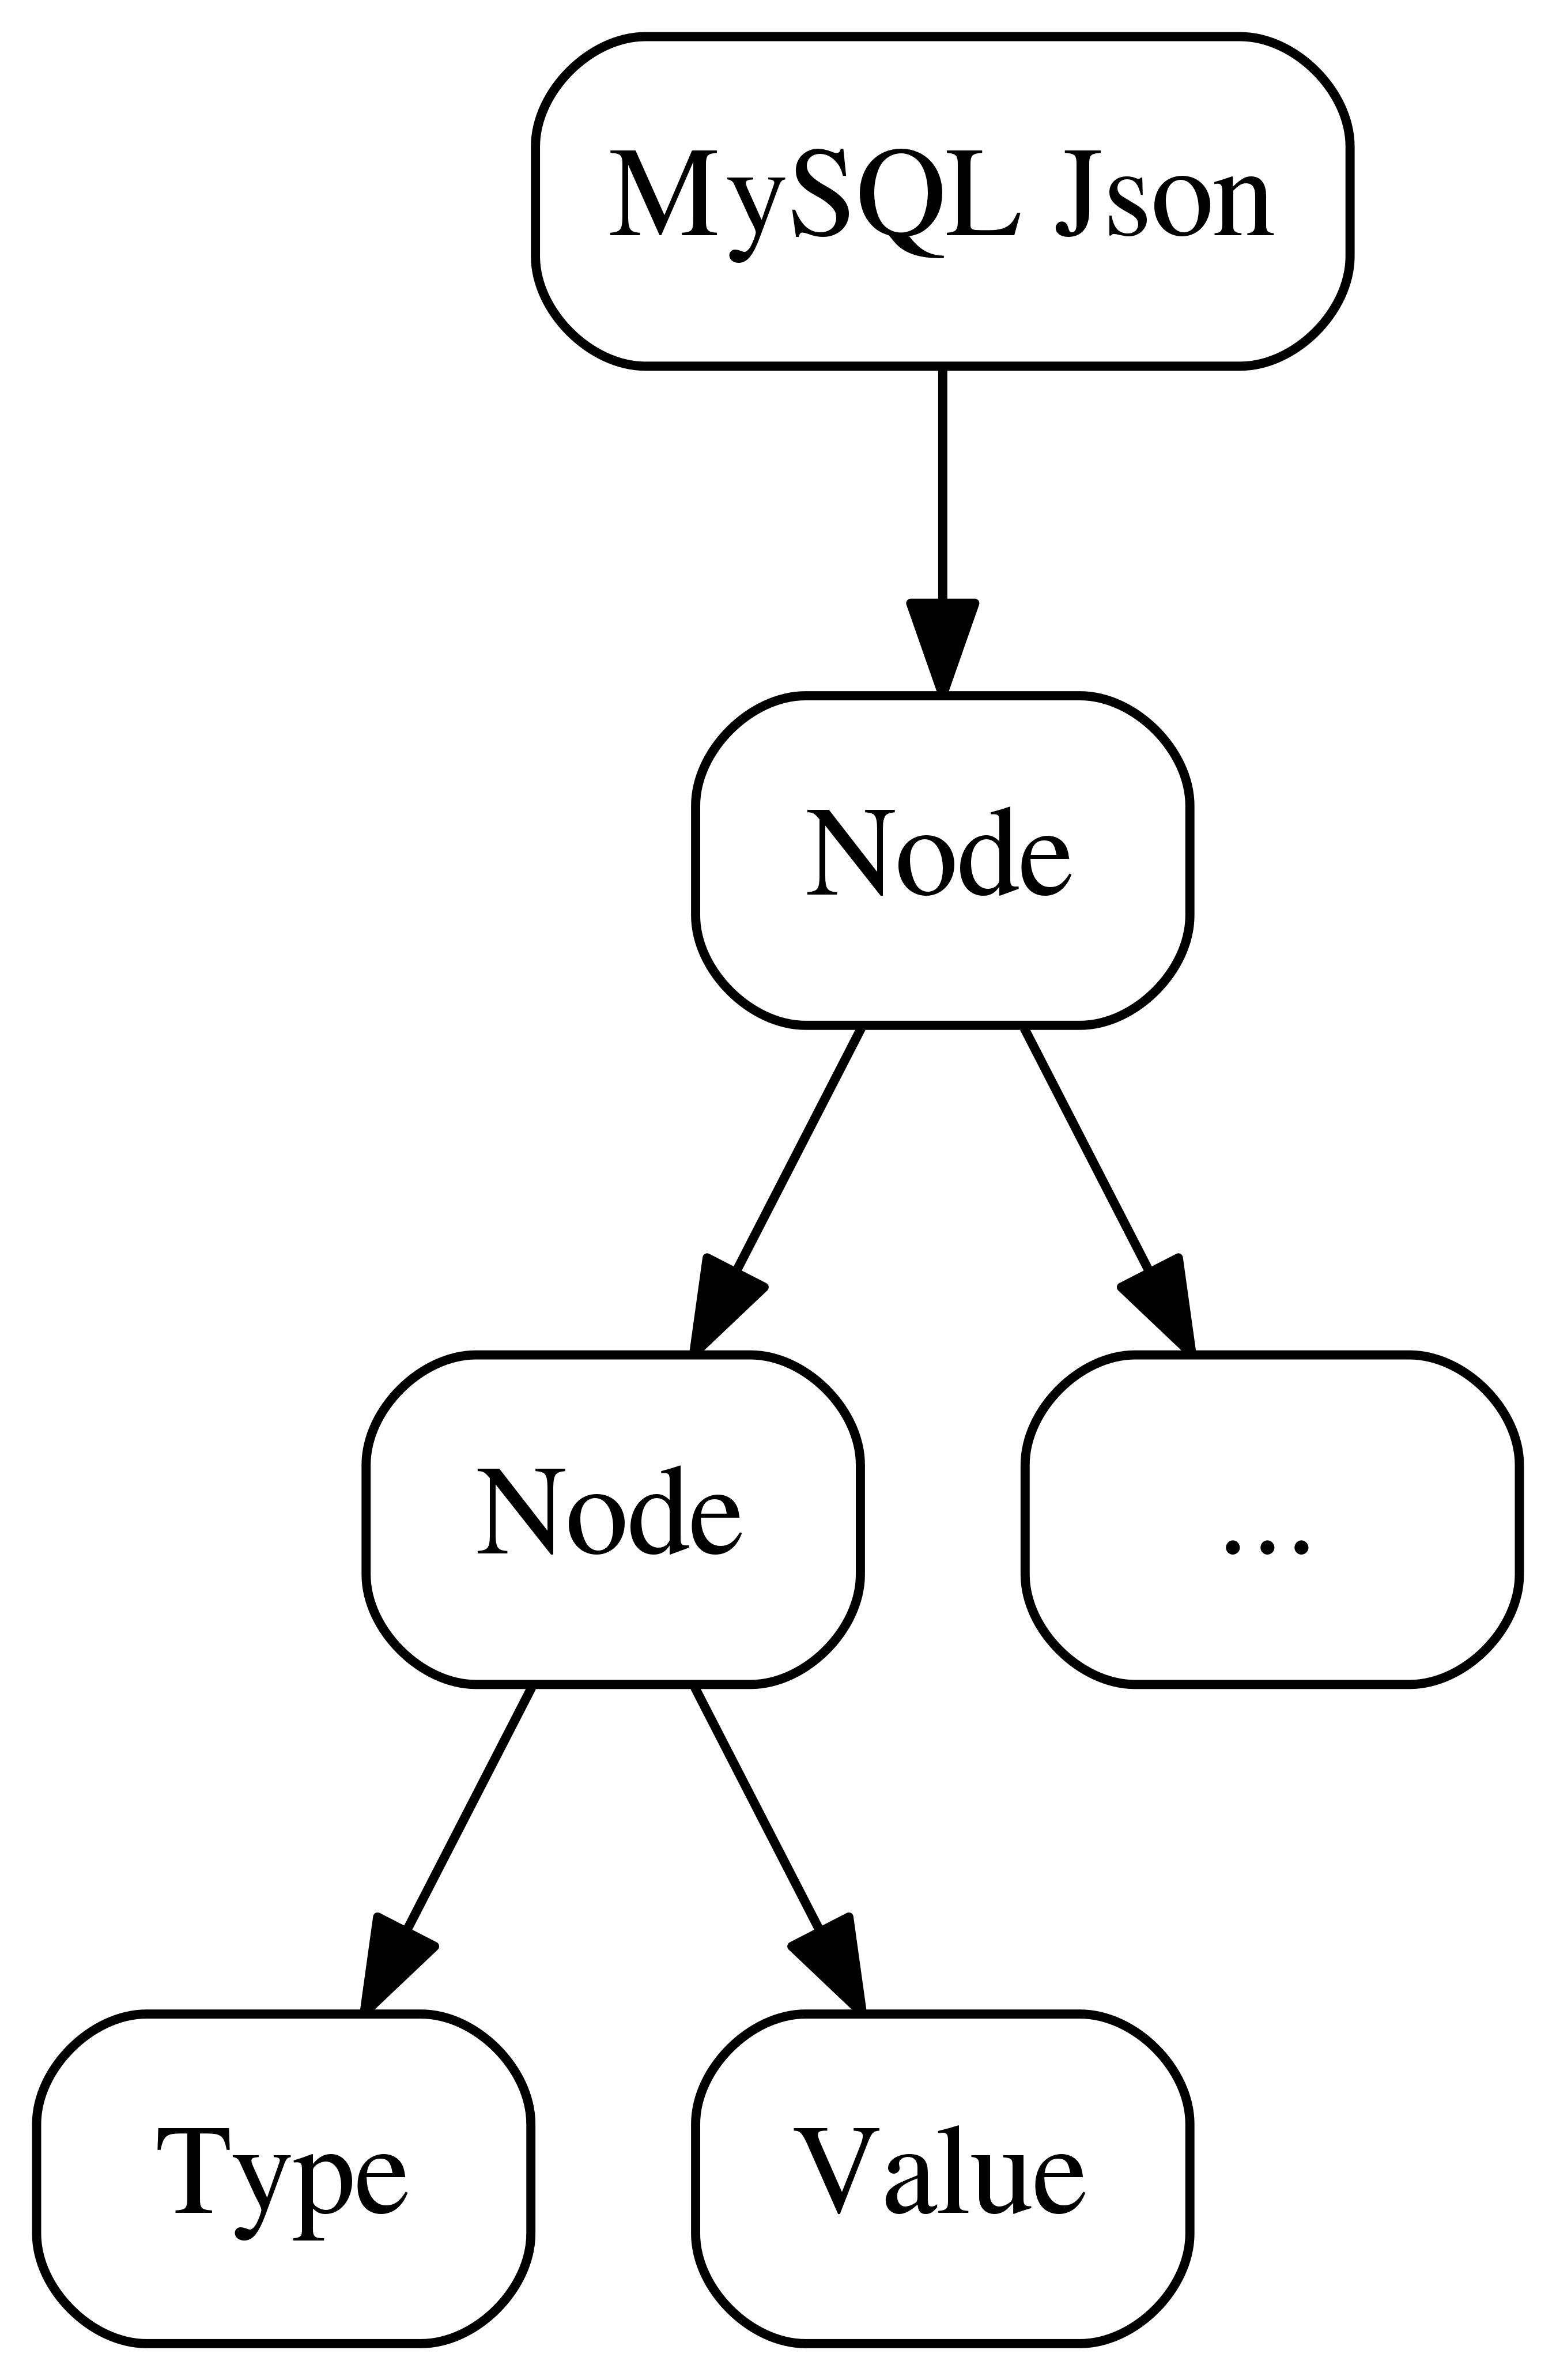
As you could guess, nodes in form of a tree, but this time without an explicit header - all the information is stored in a variable sized content block. Let’s go deeper:
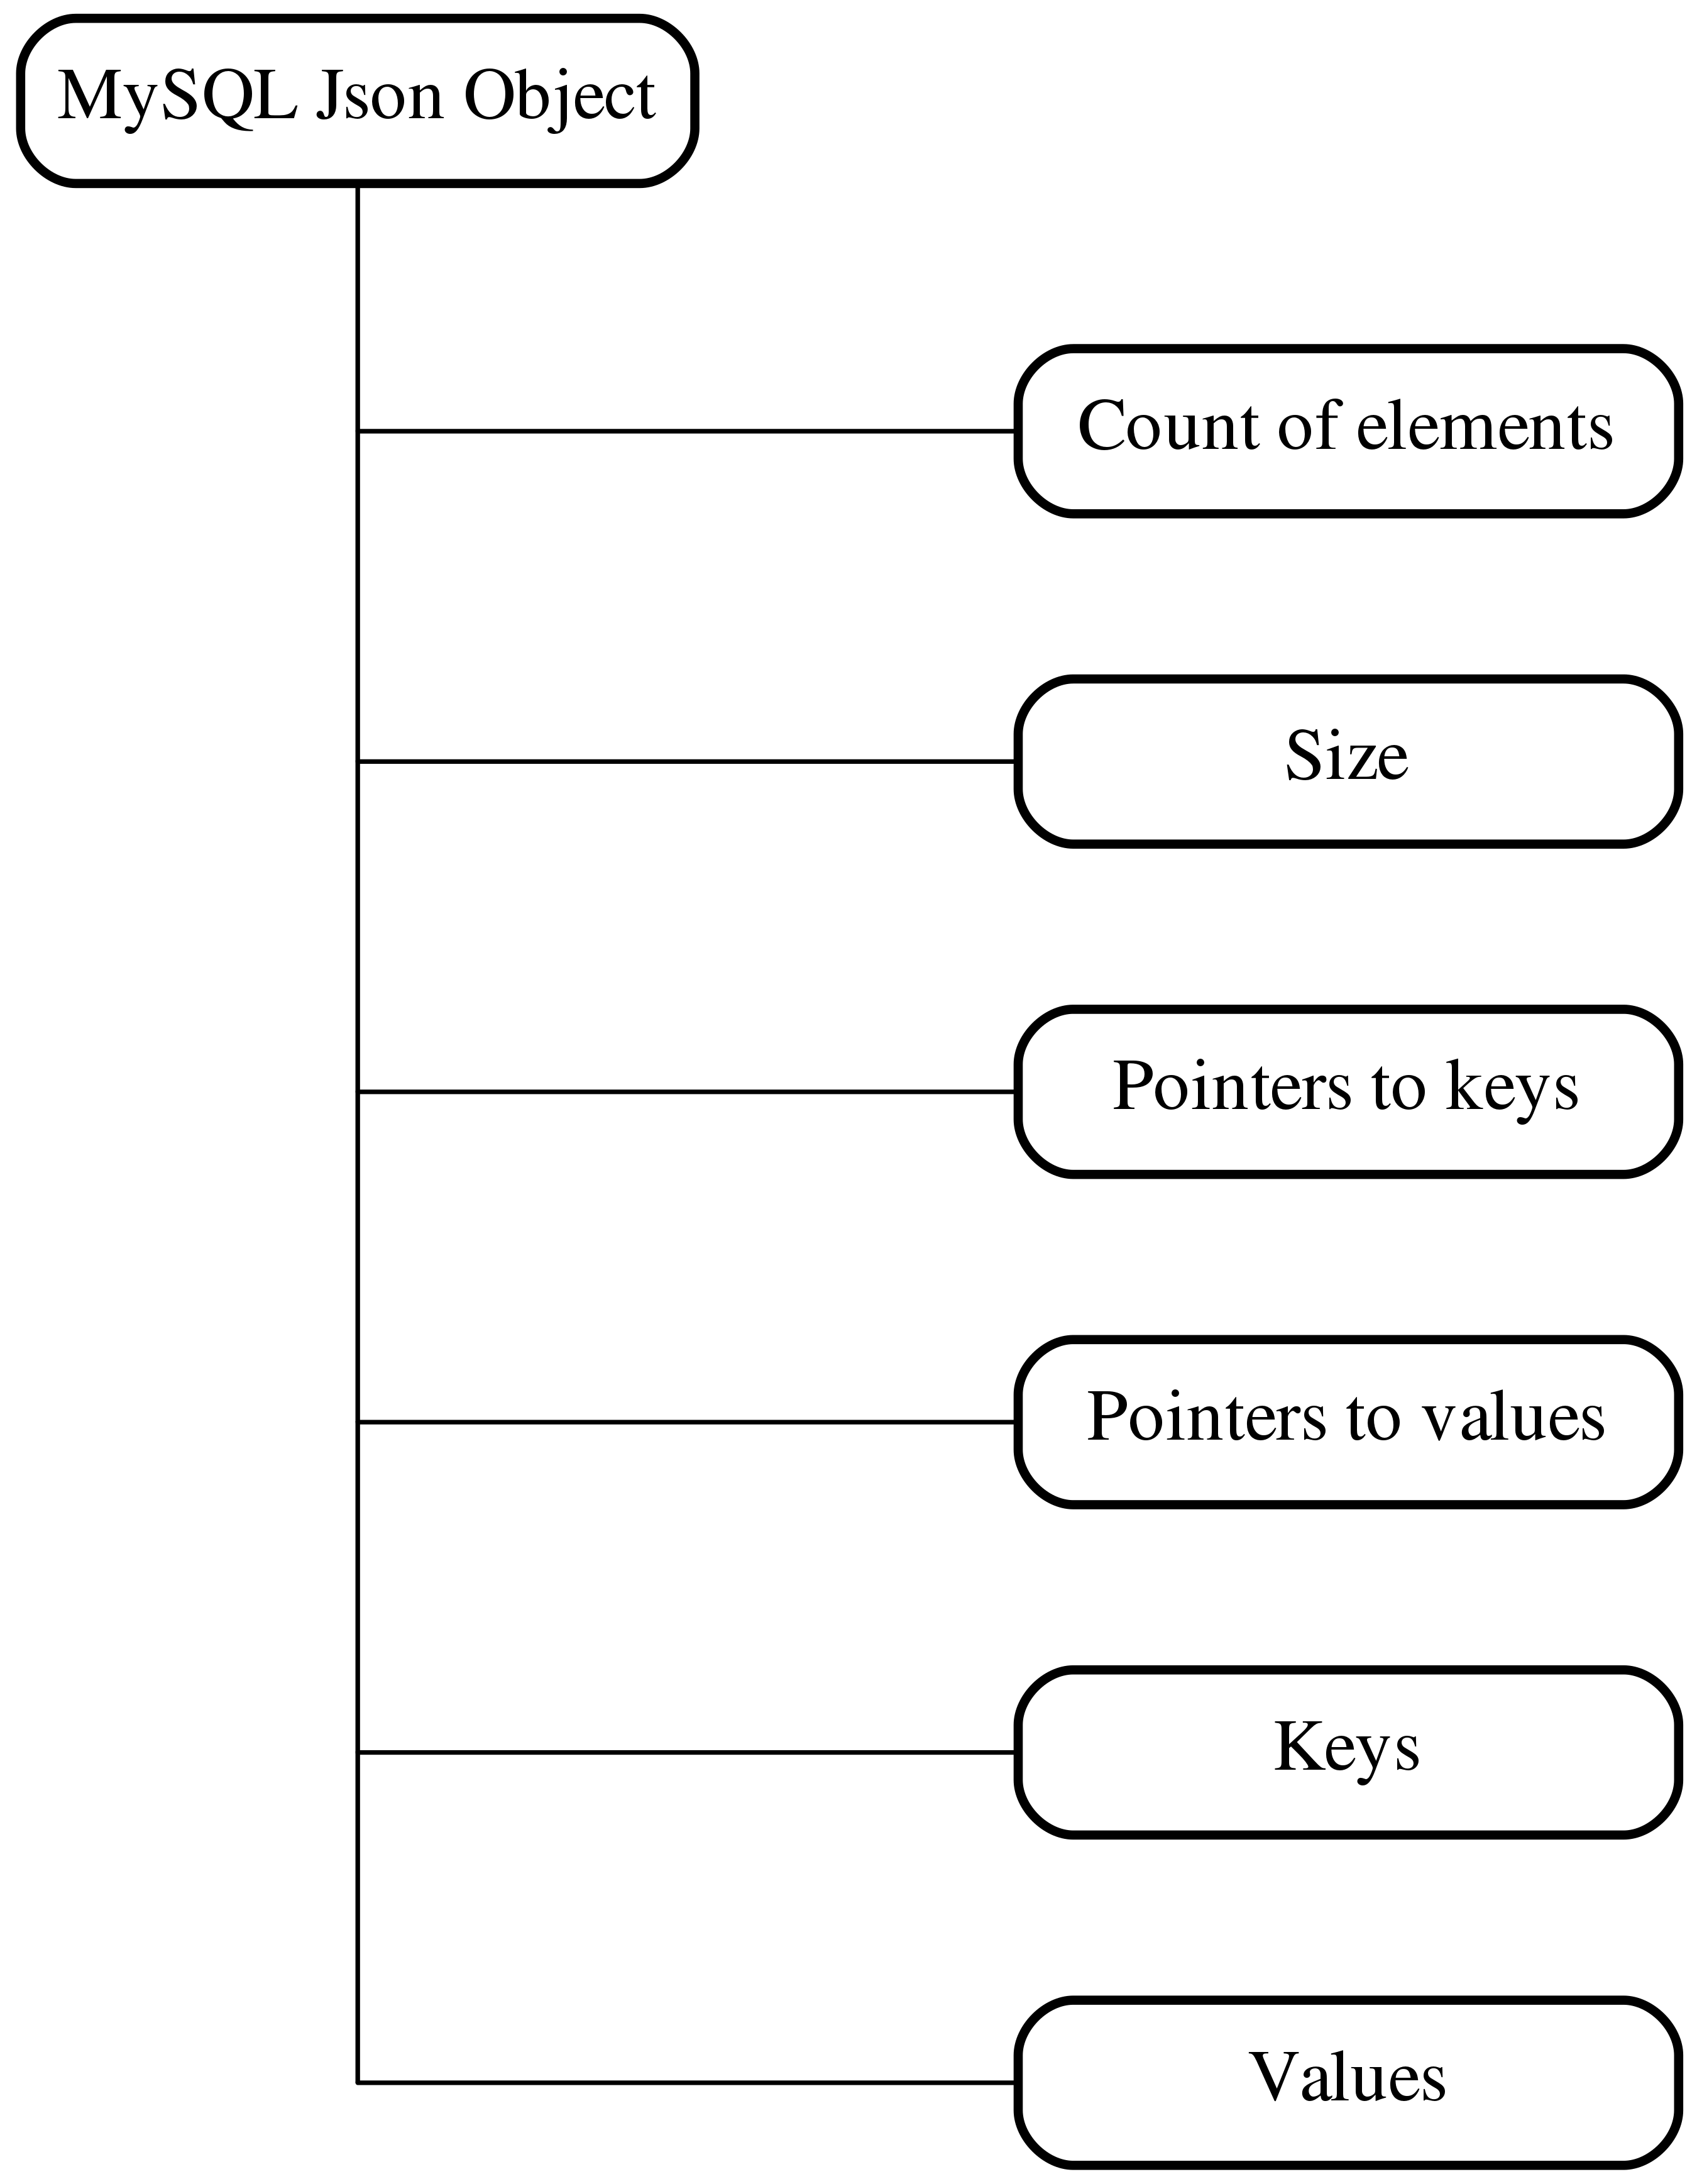
Here, together with size, keys and values we have one interesting difference -
pointers, which is an offset from the beginning of a document where you can
find this particular key or value. As far as I understood from MySQL source
code, it was done like that to be able to work with a document in a lazy way.
Another interesting thing about how documents are stored, is key/values order.
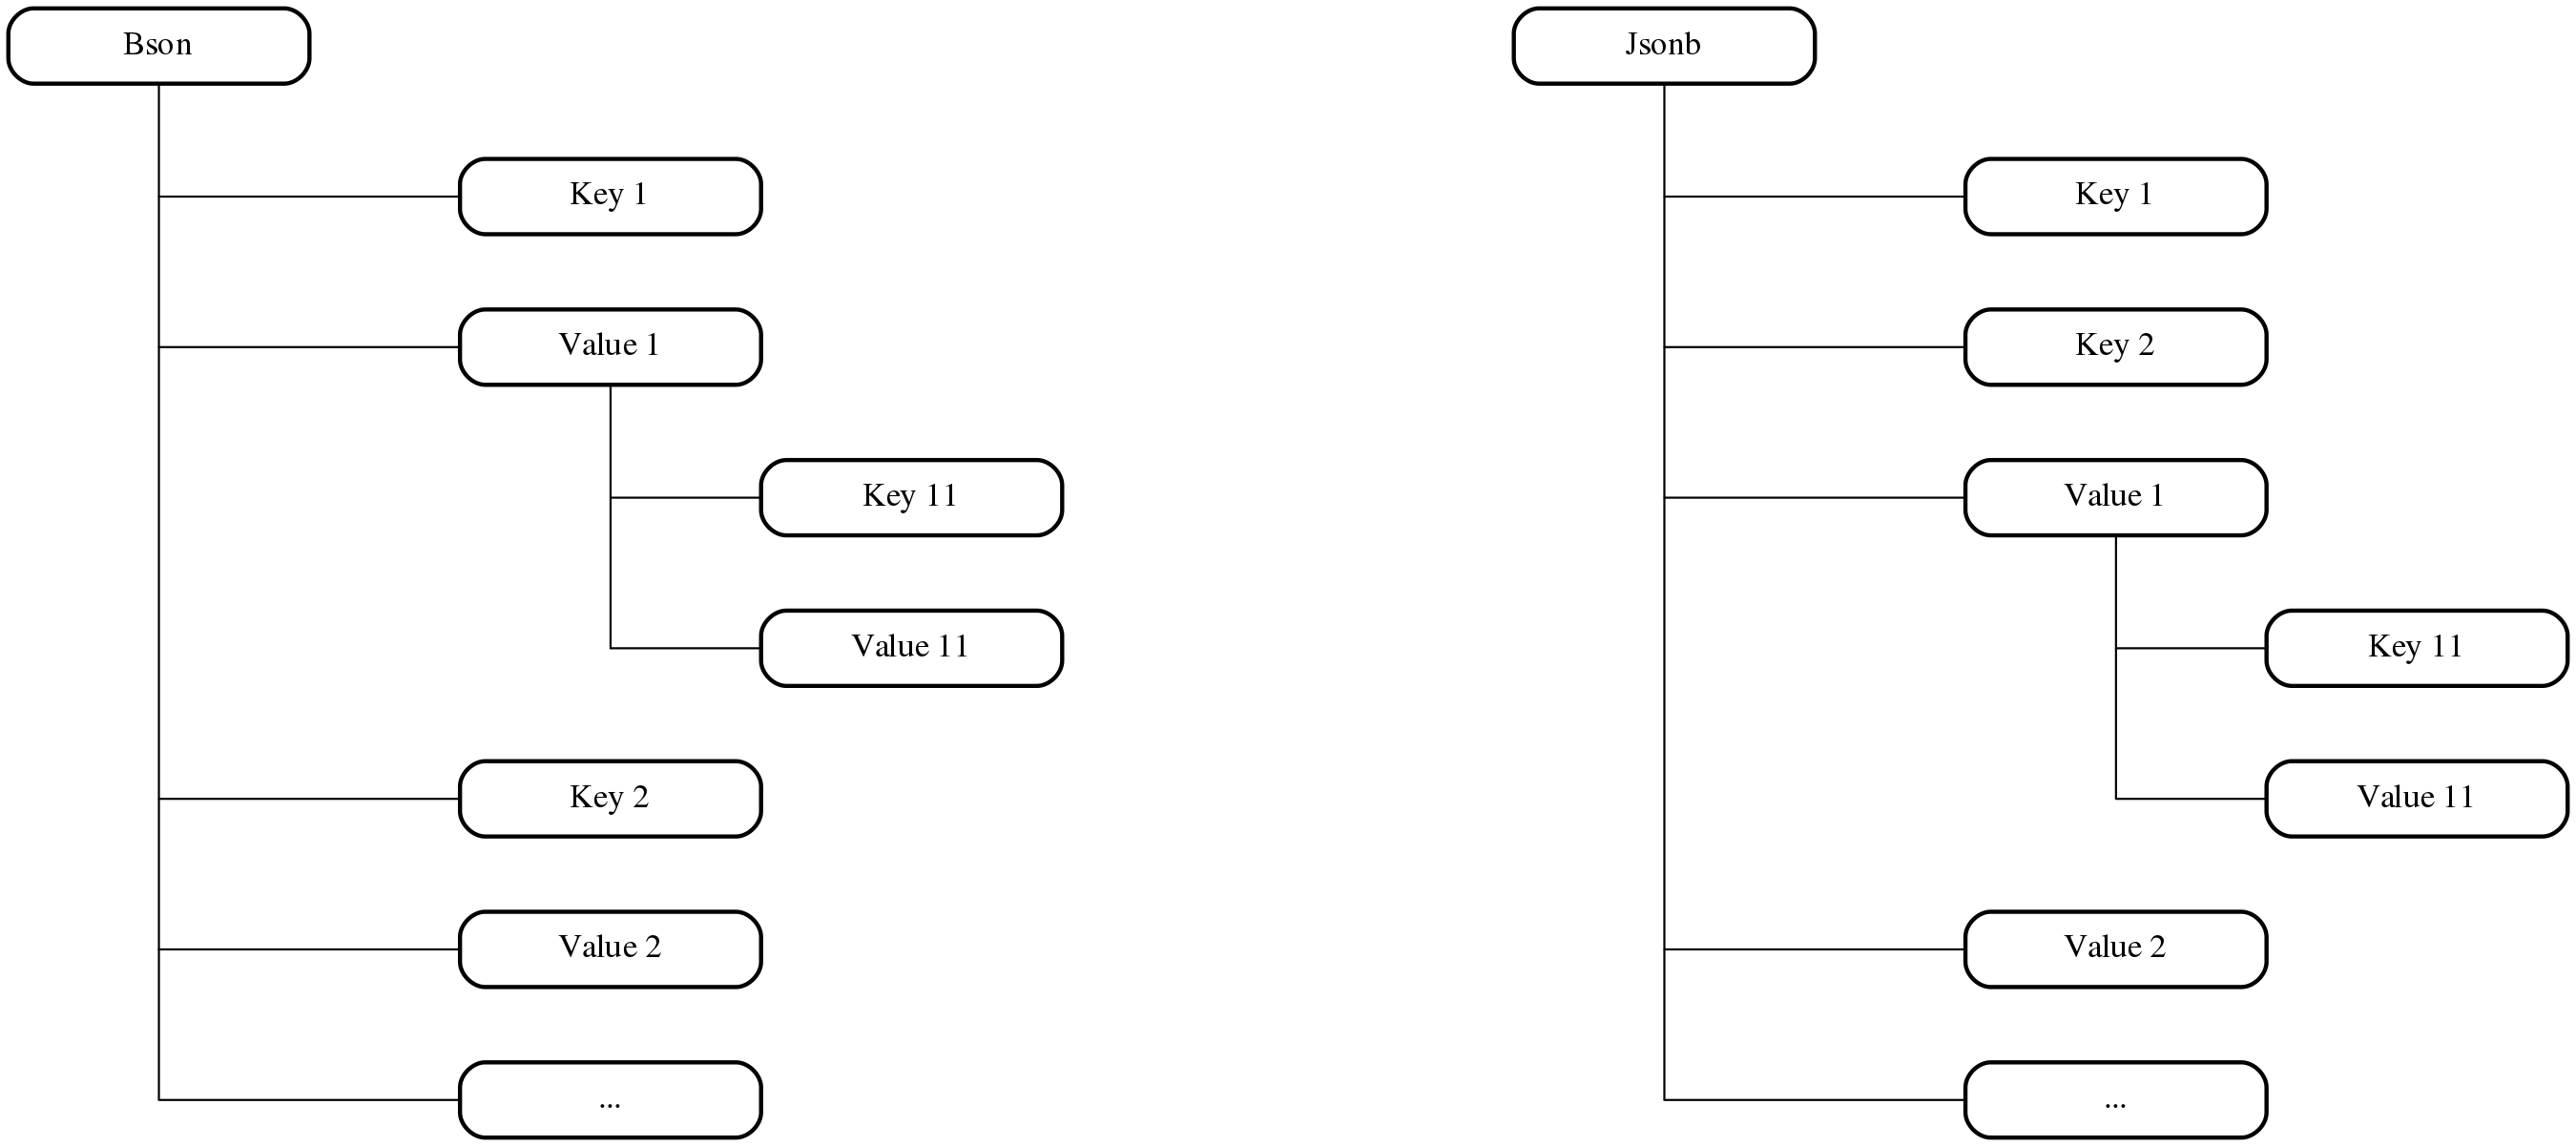
For jsonb and binary json we actually group keys and values from the same
level together. The reason is simple, in this way we can access keys a bit
faster, it’s easy to cache them and so on and so forth.
Let’s summarize. All our databases use more or less the same approach to store documents, and there are only minor differences. Just for fun here are few examples of those differences on binary level for a simple document:
{"a": 3, "b": "xyz"}
Here is what jsonb document looks like in PostgreSQL:

We can clearly see some parts of its structure and grouped together keys and values.
The same for bson:

As you can see the situation here is opposite, all keys and values are
following in the natural order, with value type, value size etc.
And finally binary json:

Again, quite long header with some pointers in it, and then grouped keys and values.
Another interesting thing to mention is that in jsonb variable sized content
and header are aligned by 4 bytes. Quite simple on its own it leads to
interesting consequences, for example here are two documents:
{"a": "aa", "b": 1}
{"a": 1, "b": "aa"}
These two documents have identical size since we just swapped values, nothing more. But if you’ll try to store them in PostgreSQL, you’ll see that the second one will take 2 more bytes of disk space:
INSERT INTO test VALUES('{"a": "aa", "b": 1}')

INSERT INTO test VALUES('{"a": 1, "b": "aa"}')

We can clearly see 4 extra bytes in the second document before and after keys
a and b. Since the first one has 2 bytes longer header, at the end we
have this 2 bytes difference. Of course, it’s not that much, but in some cases
maybe worth mentioning.
Complex documents
What we tested before involved quite simple type of flat documents without any internal structure. As I said before in real life we work with something much more complex, so let’s try to test the same read workload with the same environment, but now let’s use documents with some nested information (“complex” documents):
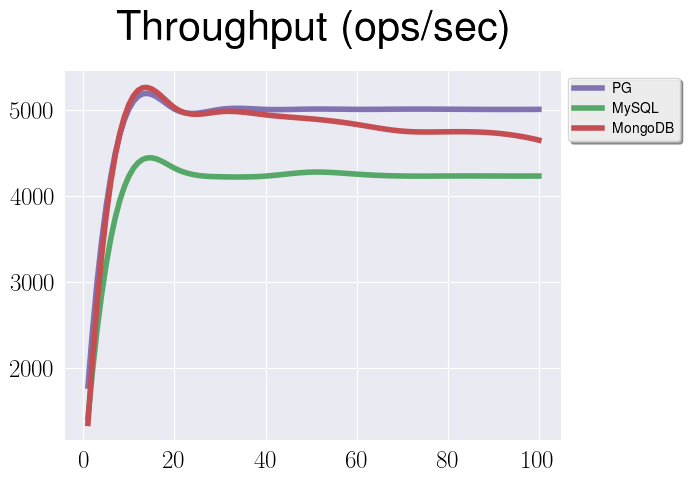
What we see here is that numbers are different just because we’re working with more complicated and bigger documents, but all the patterns are the same.
Document size
Another interesting question is how different processing for bigger and smaller
jsonb documents. Let’s replicate the same test as before, but now we’ll fix
number of clients to 40 and instead will vary the size of our documents in kB
by Ox.
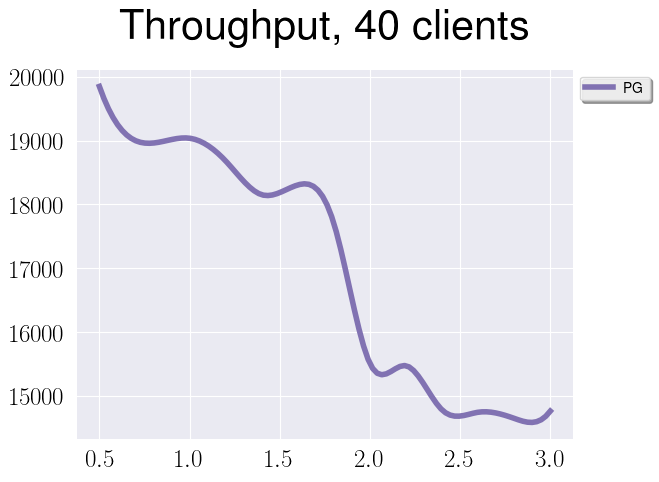
We can see interesting performance drop at about 2kB and more or less linear degradation on the rest parts of the graph. Can you guess why?

When we store our document in PostgreSQL, first of all we compress it. If even after compression a document is too big (yep, you’re right, more than 2kB), PostgreSQL will split it into multiple chunks, that will be stored in toast tables.
Parsing time
There is another interesting hack that you can see while working with jsonb. It’s perfectly fine to have a query like that:
SELECT * FROM test_table WHERE data @> '{"key": "123"}'::jsonb;
But as you may see to build a jsonb object for this condition PostgreSQL need
to parse a string, that contains jsonb definition. And it’s absolutely not
necessary, since you have many other options to create a jsonb object, e.g.
function jsonb_build_object:
SELECT * FROM test_table WHERE data @> jsonb_build_object('key', '123');
It’s not a super optimization, and I didn’t expect anything from it, but it
turns out, that with a lot of queries you can actually squeeze some ops/sec
using it. For example, let’s take a look at the first test for read-only
workload with GIN index, but now we’re going to use jsonb_build_object:
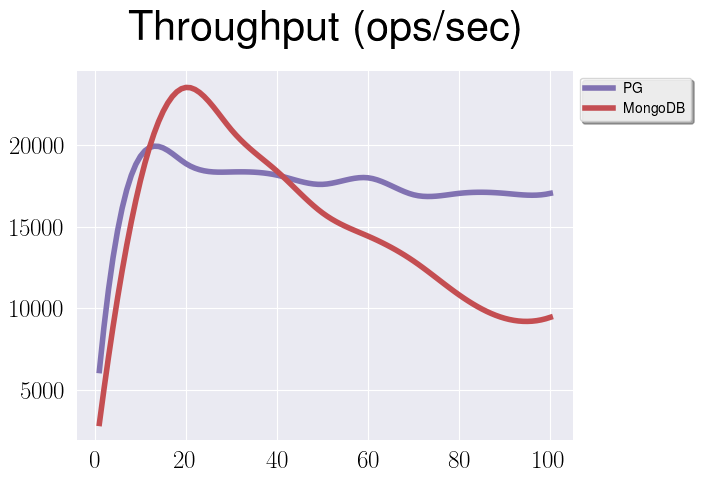
You can see, that in comparison with the original graph PostgreSQL has got few extra thousands operations per second. Just for the records - this one is a bit old test, so it involved MongoDB 3.2.5.
Scalability
So far we were doing tests using quite modest hardware, which is of course
valuable. But I have to mention, that situation can be in some way different
for more powerful instances. For example, let’s compare the same read-only test
with GIN index over an entire document for PostgreSQL on different machines,
m4.large, m4.xlarge, m4.2xlarge:
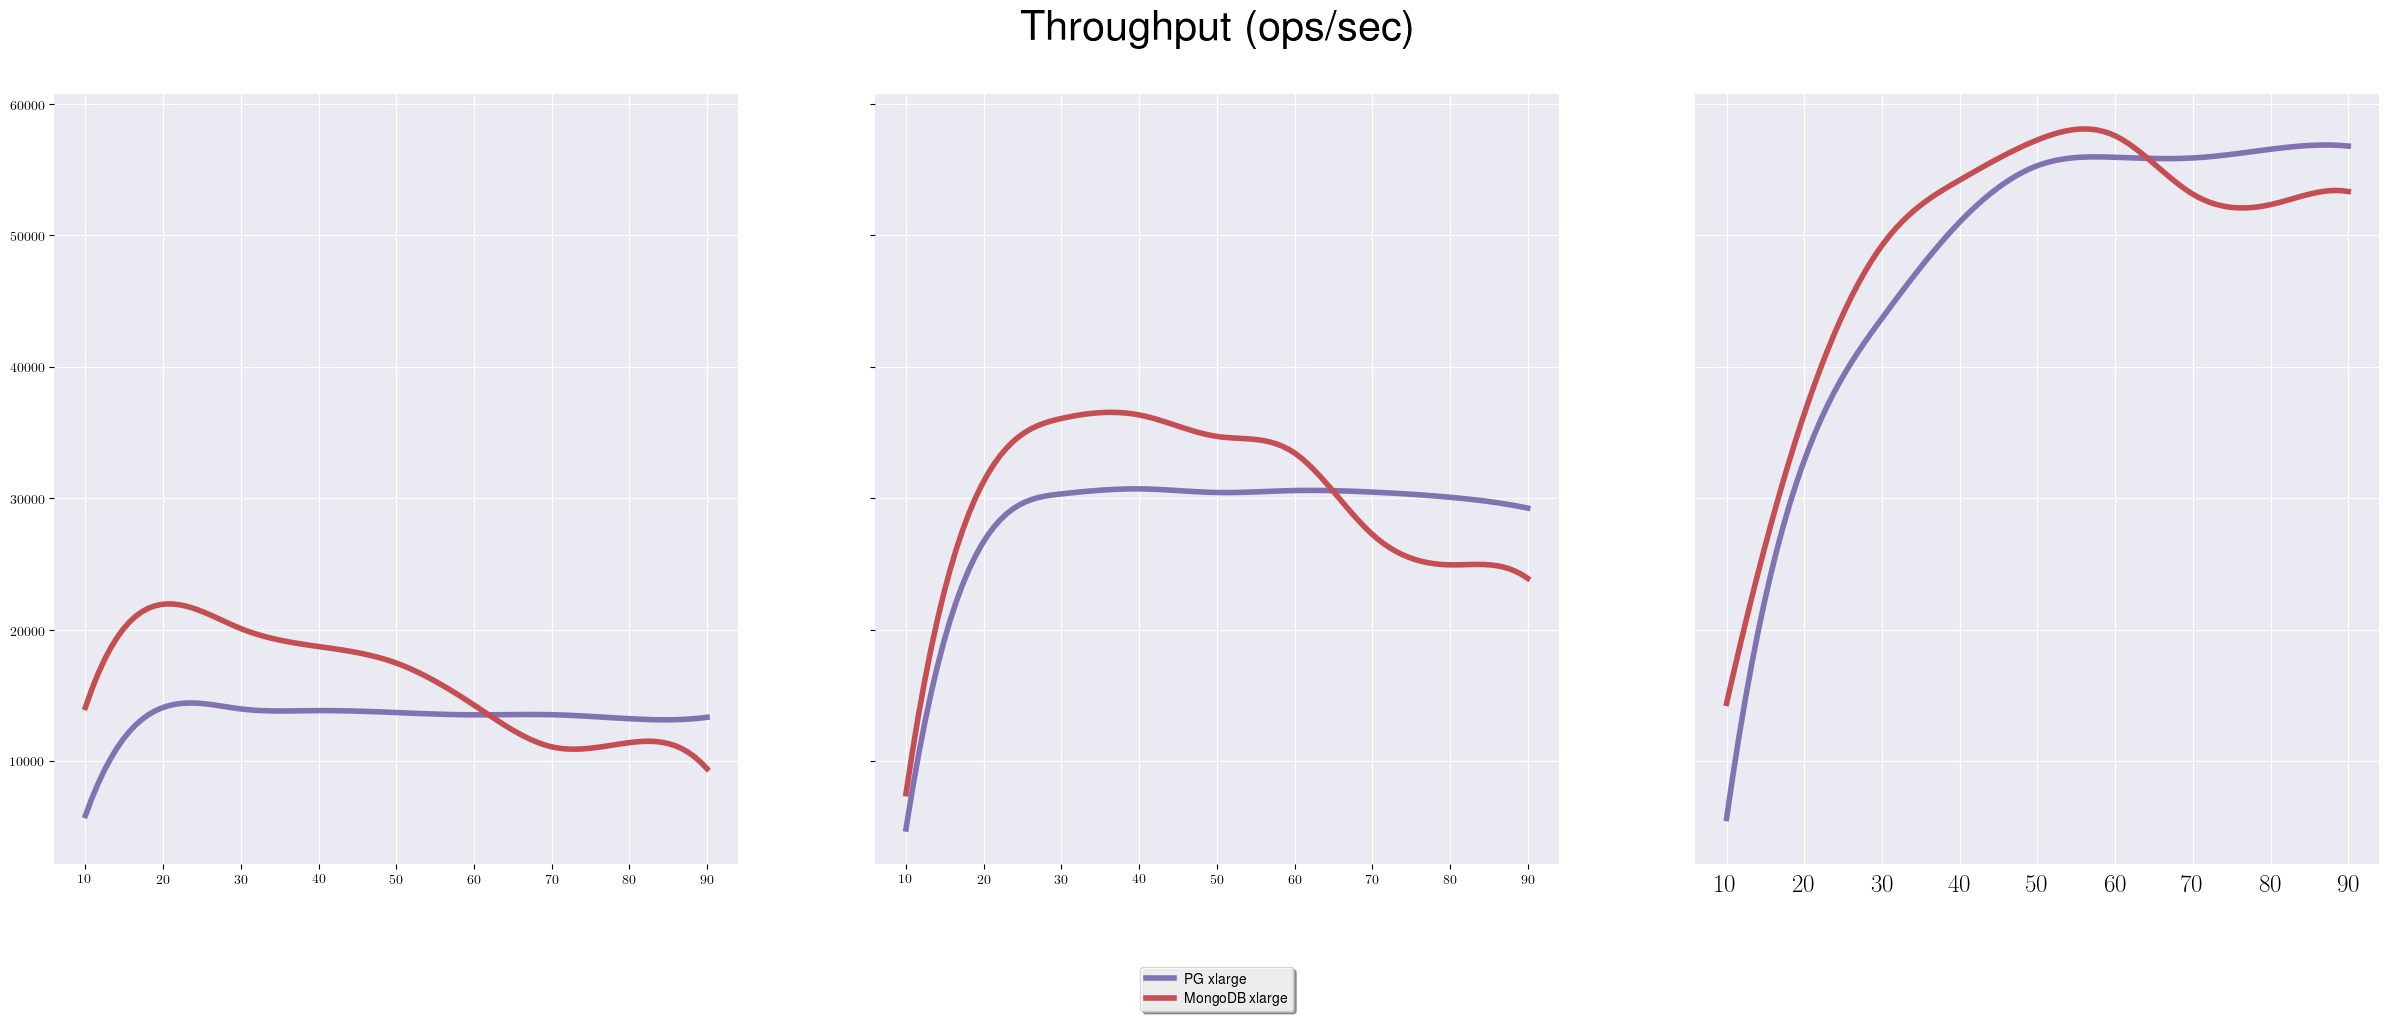
The first graph is identical to what we already saw, but there is one interesting pattern on the following two. You can see, that while getting more throughput almost linearly, the index-related gap between PostgreSQL and MongoDB is reducing. How different it’s going to be for other types of workload we will discuss later.
Insert workload
Since there are so many interesting workloads in YCSB, let’s explore them. The next one would be the insert-only workload. Originally I made a mistake here (I must say I make mistakes professionally, some of them are almost like an art) and tried to do the test with almost the same setup as before with an index over a document ID for all databases. The problem is that I had also to configure checkpoints properly, because default configuration of all databases is just not suitable for this workload. Let’s take a look:
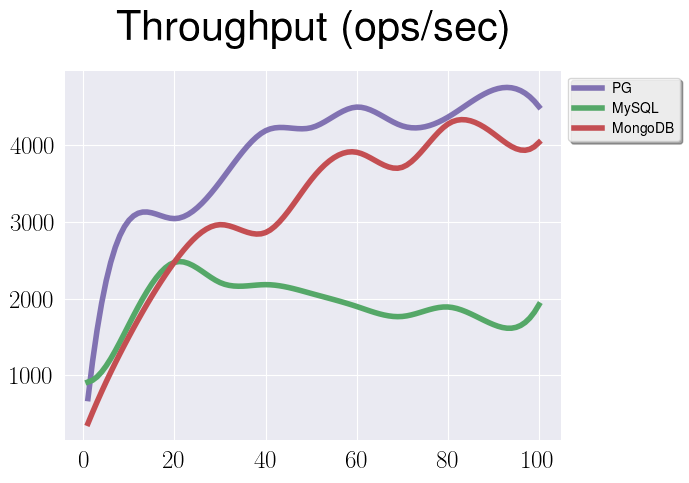
You can see that data has an oscillating pattern. If, for example, we would like to see some metrics, we could realize that this test is IO bounded:
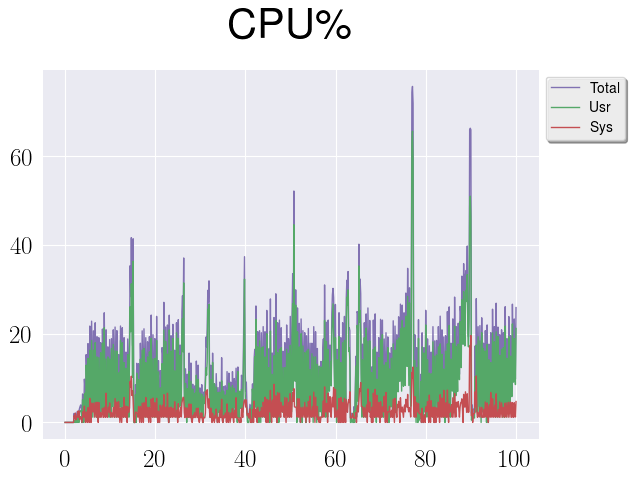
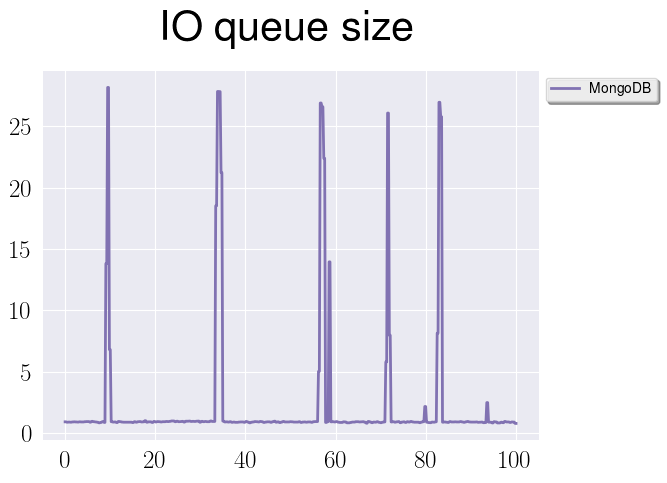
On the last graph we can see queue size for IO operations during the time.
Those spikes are correlated with checkpoints, when database is flushing data to
disk, and it’s doing it too frequently. So, taking this into account, let’s
adjust out checkpoints configuration (I’m talking here about max_wal_size,
checkpoint_completion_target, innodb_log_file_size, checkpoint +
eviction, that I’ve mentioned already. Also, please note, that MySQL has two
journal files by default, and innodb_log_file_size is for each of them):
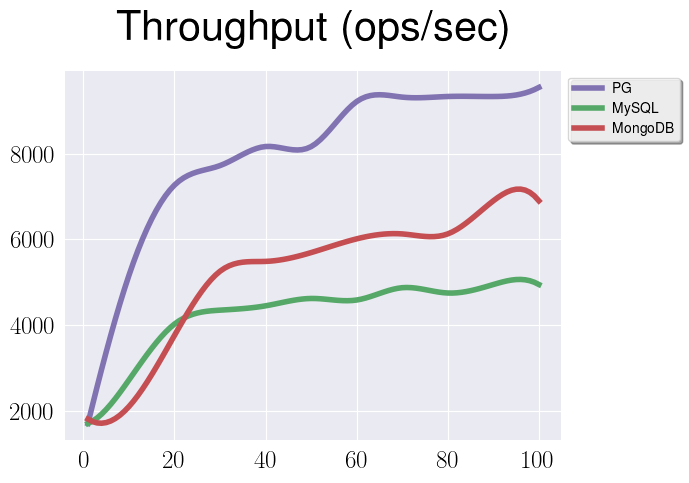
This time data is more representative, and we can see interesting thing, that
PostgreSQL is more competitive here in terms of throughput. MySQL and MongoDB
are on more or less the same level, but there is a catch - actually, to get
a bit more from MySQL I used “wrong” setup, when virtual column for
a document id had no PRIMARY KEY statement. In this case we can get better
numbers for insert workloads (but everything else would be terrible), and
without it there would be even less throughput for MySQL. As far as I
understood it’s a well-known situation when MySQL handles insert workload not
that good and there are a lot of forks out there to address this problem.
Update workload
Before we will talk about update workload, let’s discuss another related topic - what kind of problems can we get while updating jsonb? The thing is that despite the fact that we think about it as a document with some structure, for PostgreSQL it’s still a regular data type. Which means sometimes there may be situations when we touched only small part of a document, but database need to walk through an entire document to do something. Here are few examples what I’m talking about:
-
Update one field of a document
-
DETOAST of a document
-
Reindex of a document
Reindex
The story here is quite simple. So far in PostgreSQL if you created a
functional index for a jsonb column, and then updated some part of a document,
that was not involved in index at all, database will still reindex this
document. To see if it can be significant or not let’s make another test with
two setups - one is when we have an index on ID from a document and another
when we have an index on a separate column that contains the same kind of ID,
just separately from a document. As a workload for this test I used
WorkloadA, which is 50% of updates and 50% of reads, everything else was
similar to previous tests.
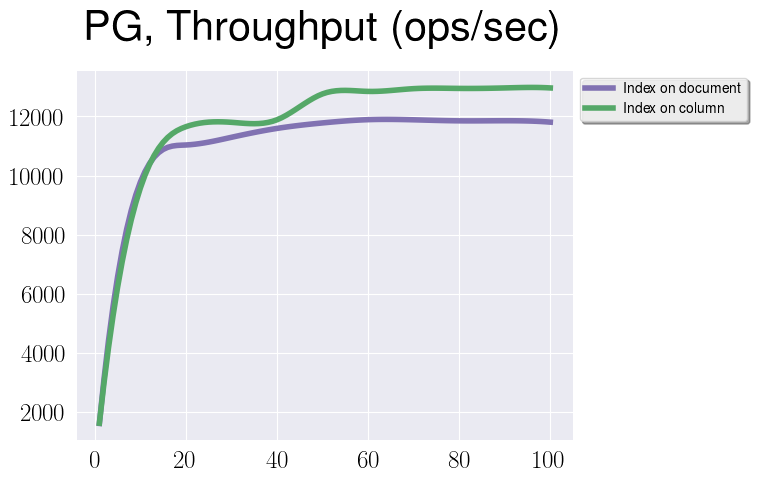
From this graph we can see, that there is a difference in throughput. It maybe not that significant, but please keep in mind that it heavily depends on document type, and I would expect that for large and more complicated documents (where reindex can introduce more overhead) this difference is going to be bigger. And I glad to mention that some work on this is underway.
DETOAST
Let’s compare following two queries:
SELECT data->'key1'->'key2' FROM table;
SELECT data->'key1', data->'key2' FROM table;
At the first glance there is no significant differense between them, but this
impression is wrong. In the first case data is detoasted just once,
everything is fine. Unfortunately, in the second case data is detoasted twice
for both keys. And it’s like that not only for jsonb, but for all composite
data types in PostgreSQL. In general, it’s not a big issue, but if our document
is quite big and we’re trying to extract too many keys, we can end up with huge
overhead.
To proof this statement let’s make an experiment and repeat the same read-only test as before (with an index on ID for PostgreSQL). But this time we’re going to fetch just 10% of a large document:
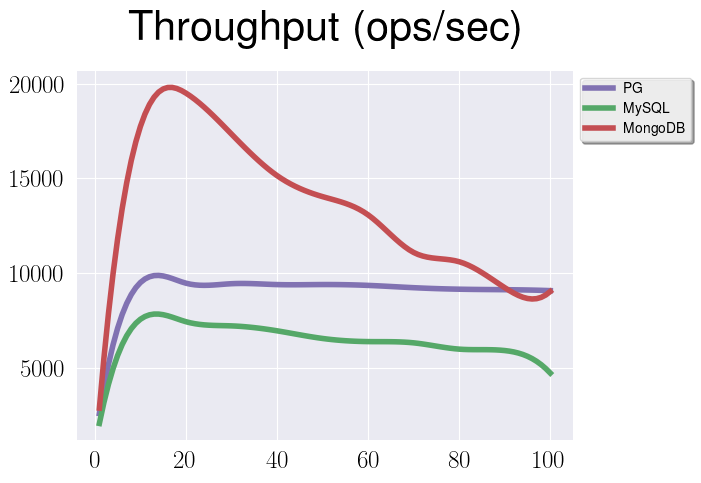
We can clearly see, that in this case overhead is tremendous for both PostgreSQL and MySQL. There are two possible solutions for this problem:
-
Disable compression for jsonb column using
ALTER TABLE table_name ALTER
COLUMN column SET STORAGE EXTERNAL
. In this case you can more or less avoid detoasting overhead by the cost of disk space. -
Change the query
I want to elaborate a bit on the last one. Since we work within a proper relational database we can just convert our document to a SQL structure like a record and then do whatever we want:
CREATE TYPE test AS ("a" TEXT, "b" TEXT);
INSERT INTO test_jsonb VALUES('{"a": 1, "b": 2, "c": 3}');
SELECT q.* FROM test_jsonb, jsonb_populate_record(NULL::test, data) AS q;
And it’s actually quite common pattern to work with documents in PostgreSQL so far, since there is no full-fledged support for Json Path. Of course there are extensions that provide something like Json Path, there is even this big thing SQL/JSON coming to PostgreSQL. But at least at the moment to get a solution when Json Path is truly necessary we can use this “unwrap” pattern.
Let’s imagine that we have a collection of documents, and from every document
we want to extract all items with value = "aaa":
[{
    "items": [
        {"id": 1, "value": "aaa"},
        {"id": 2, "value": "bbb"}
    ]
}, {
    "items": [
        {"id": 3, "value": "aaa"},
        {"id": 4, "value": "bbb"}
    ]
}]
For that we can “unwrap” documents using function jsonb_array_elements to do
something like that:
WITH items AS (
    SELECT jsonb_array_elements(data->'items')
    AS item FROM test
)
SELECT * FROM items
WHERE item->>'value' = 'aaa';
Or similar situation when we want to get all items with status = true:
{
    "items": {
        "item1": {"status": true},
        "item2": {"status": true},
        "item3": {"status": false}
    }
}
Again we can use jsonb_each function to unwrap our document:
WITH items AS (
    SELECT jsonb_each(data->'items')
    AS item FROM test
)
SELECT (item).key FROM items
WHERE (item).value->>'status' = 'true';
Of course this approach can lead to quite verbose queries (just imagine if you want to update something in a document this way, you have to “unwrap” and “wrap” it back) and that’s why we have patches like SQL/JSON. But at the same time don’t think about that as an ugly hack, because in fact it’s quite important thing - it’s a point when document-oriented approach meets relational approach, a point when you can apply full power of SQL to your documents.
Update
Now let’s finally talk about update workload. The problem here is that when we
update let’s say one field of a jsonb document, PostgreSQL will write to
journal an entire document, and as you can imagine it’s an overhead. The
question is when this overhead can be significant? Let’s experiment with
WorkloadA with default checkpoint configuration and documents of small size:
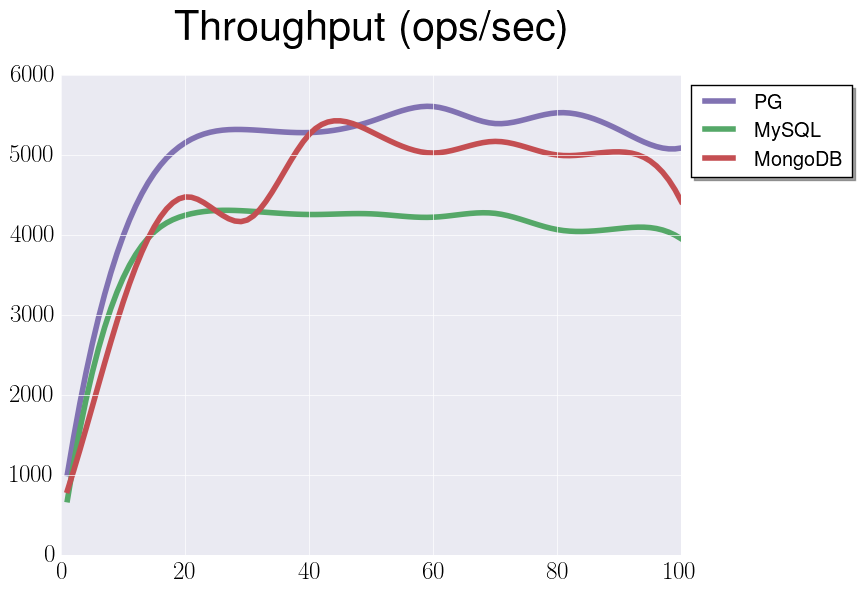
Interesting enough that we have more or less stable data, and overhead that I’ve mentioned before is insignificant. Not let’s do the same with properly adjusted checkpoints:
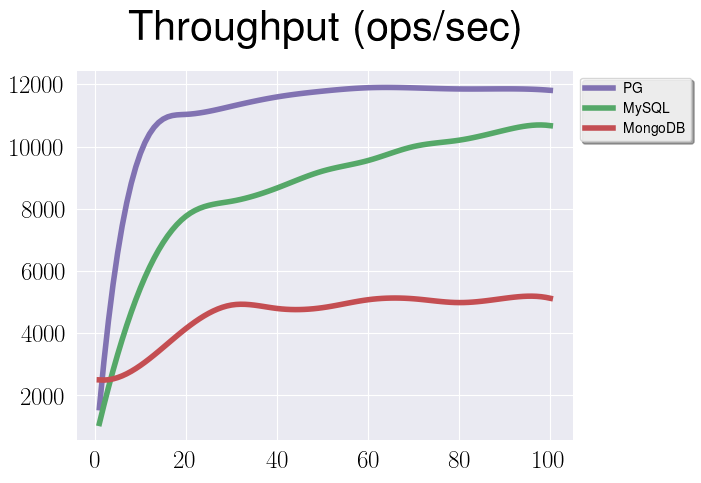
Here we can see another interesting thing - after checkpoints adjustment
PostgreSQL and MySQL are at the same level in terms of throughput, and,
unfortunately, configuration for MongoDB didn’t help so much. At first, I
thought that I configured checkpoints incorrectly and MongoDB is still doing
them too frequently (and it makes sense, since I was using log_size option to
adjust the journal size, but it turns out that WiredTiger has a limitation on
maximum value for it 2Gb). But even after I switched on using wait option and
db.serverStatus() was showing that transaction checkpoints is 1, the
throughput was still at the same level.
At the end of the day I’m still investigating this performance gap, buy anyway the expected results would be that MongoDB throughput is below PostgreSQL and MySQL, just not that much. And this time again we can say, that overhead I’ve mentioned before is insignificant. Now let’s make the same test with the same configurations, but for large documents:
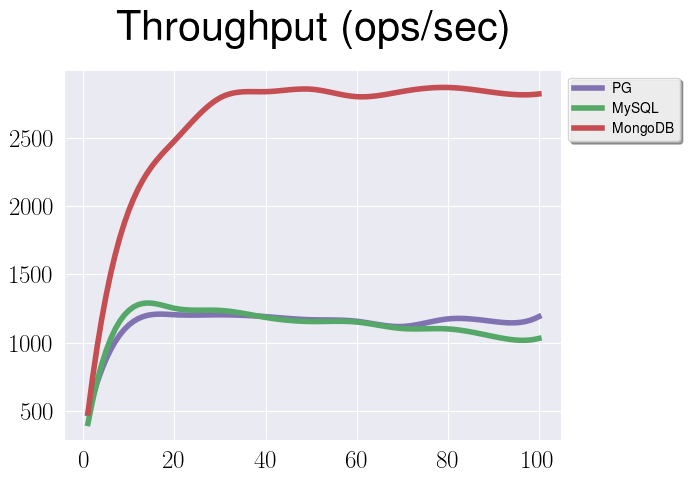
And finally overhead is significant. To demonstrate that, let’s see what would happen if we want to update this small document:
{
    "aaa": "aaa",
    "bbb": "bbb",
    "ccc": "ccc"
}
We want to change the first field:
{
    "aaa": "ddd",
    "bbb": "bbb",
    "ccc": "ccc"
}
And here is what we will have in the journal for different databases:
PostgreSQL

MySQL

MongoDB

We can clearly see, that MongoDB is only writing a difference between the old and new documents.
But there is one interesting thing - actually, when we update a document, if both old and new versions of it are on the same page, PostgreSQL will write only the difference to the journal which is what we want. The problem is that documents tend to be quite bigger, so that the possibility of being on the same page is lower than usual (even for a small document like one above on my laptop it was somehow not all the time). And obvious way to improve the situation is to enable huge pages. As a quick reminder, you can use this or this instructions to estimate how many pages it makes sense to preallocate:
sysctl -w vm.nr_hugepages=1000
and then enable huge pages in PostgreSQL:
huge_pages = on # by default it's try
Unfortunately I don’t have yet any benchmarks for that, but from manual experiments I can see that, with huge pages 2048kB and simple document type, updates are saved as diff most of the time.
Note: as Bruce mentioned in the commentaries, actually huge pages have no
effect on the size of heap page. Looks like I’ve got this result on my laptop
because of some side effect of huge pages being enabled. But anyway, you still
can change the PostgreSQL heap page size by compiling it with
--with-blocksize.
Another thing worth mentioning is that this problem also was addressed in the recent development versions of MySQL, namely 8.0.3. This version has a feature called “Partial Updates of JSON Values”, but I never tested it yet.
Before we’ll finish this section I have to mention, that all the tests were
done using not that powerful EC2 instances, and results actually are different
for setups with e.g. more CPUs. Right now I’m working on that, and in the
meantime you can check out the results (one,
two, three) of my colleagues with more competitive
hardware. They actually covered all the workloads that YCSB can provide, but
using a bit different setup mostly with synchronous_commit = off.
Jsonb vs Json vs Table
So far we were comparing three different databases, but the thing is that there
are alternatives to jsonb even inside PostgreSQL itself. If you have to store
some documents it’s absolutely valid question, maybe it makes sense to store
them as a plain json just from performance perspective? Or even unwrap documents
into a proper sql relation because of the same reasons. You may consider these
options if you don’t care that much about flexibility that jsonb provides.
Let’s see what numbers we’ll get from the same kind of tests between jsonb,
json and a regular table:
- Relation vs Jsonb, read-only workload
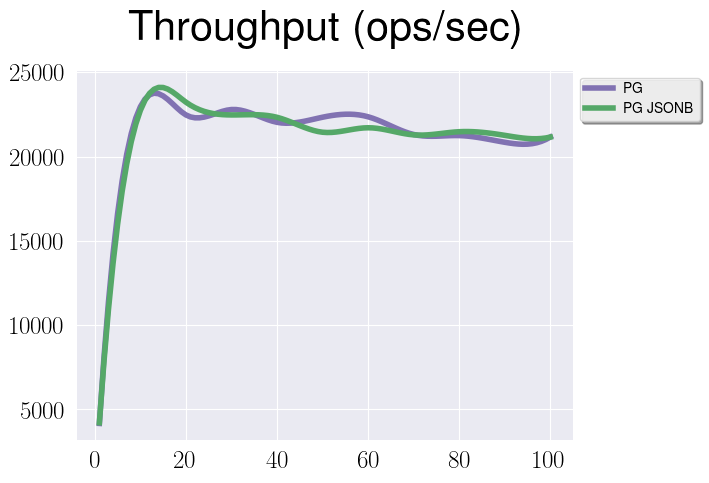
Well, not that much difference.
- Relation vs Jsonb, insert-only workload
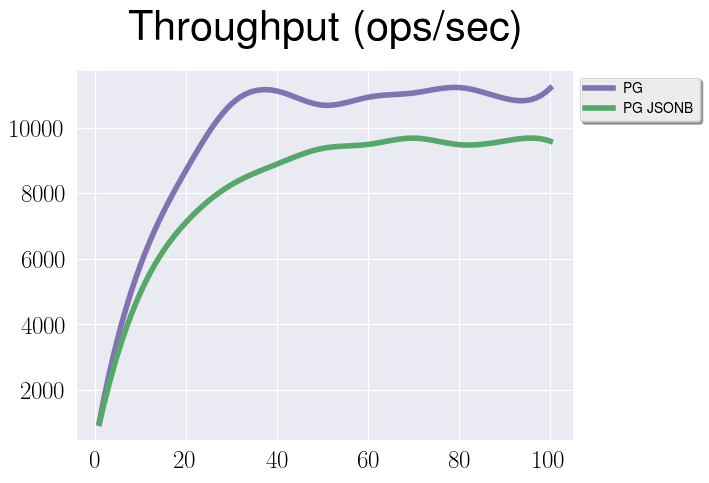
There is some performance gap but it’s not that big. Basically, we can see, that since relations are first-class citizens in PostgreSQL, maintain their internal structure is a bit easier that do it for jsonb. At the same time it’s almost the same in terms of performance to fetch one row from a relation and one jsonb document.
- Plain Json vs Jsonb, read-only workload
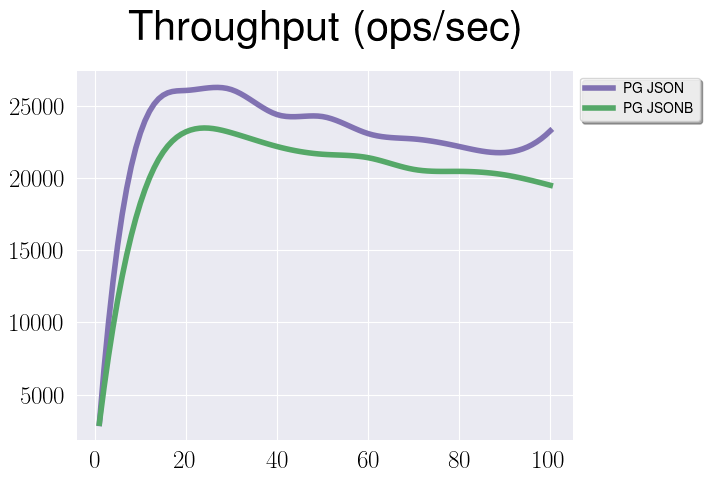
Again we can see some performance gap and plain json is a little bit faster. The explanation is simple - we have some internal structure in jsonb that introduces some overhead in terms of maintaining this structure and just in terms of disk space. But as we can see from graph above this overhead is not that big.
- Plain Json vs Jsonb, insert-only workload
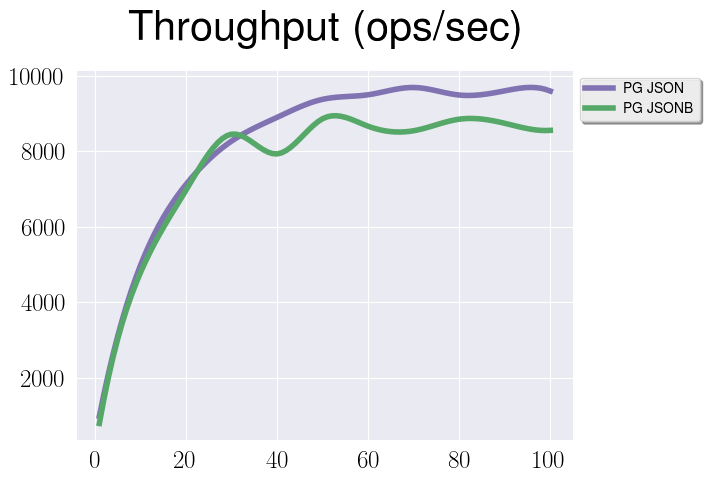
Because of the same reasons that I’ve mentioned above json is a bit faster, but not significantly.
You may guess, that I’m not talking about update workload at all because it doesn’t make sense - jsonb will totally outperform json, but it will be slower in comparison with an sql relation. At this point you may think about jsonb as something between plain json and sql relation - it has some internal structure and you can work with it in an efficient manner, and at the same time it provides some level of flexibility.
Conclusions
The main conclusion is that this is a damn interesting topic to research and I’m still continuing to do so. I really hope that I can get some positive feedback and improve my tests even more.
Another interesting conclusion is that basically all the performance differences I’ve shown above were mostly caused by databases themselves, not by the way how they handle documents. Which means that it’s totally not a gray area, it’s something well-known for us. In most cases you may use documents in relational databases and even migrate from NoSQL solutions, if it’s necessary, without any fear of significant performance degradation.

Acknowledgement
Big thanks to Alexey Kopytov, who helped me a lot with MySQL setup, to Wei Shan Ang, who reviewed this text and shared his experience about MongoDB configuration, and to Oleg Bartunov for the original idea.